US Indicators Economic Forecasts
We benchmarked 93 forecasts across 10 indicators. Periods span Jan 31, 2025 to Oct 31, 2025. Predictions were compared against Trading Economics and market consensus baselines.
Forecast Questions
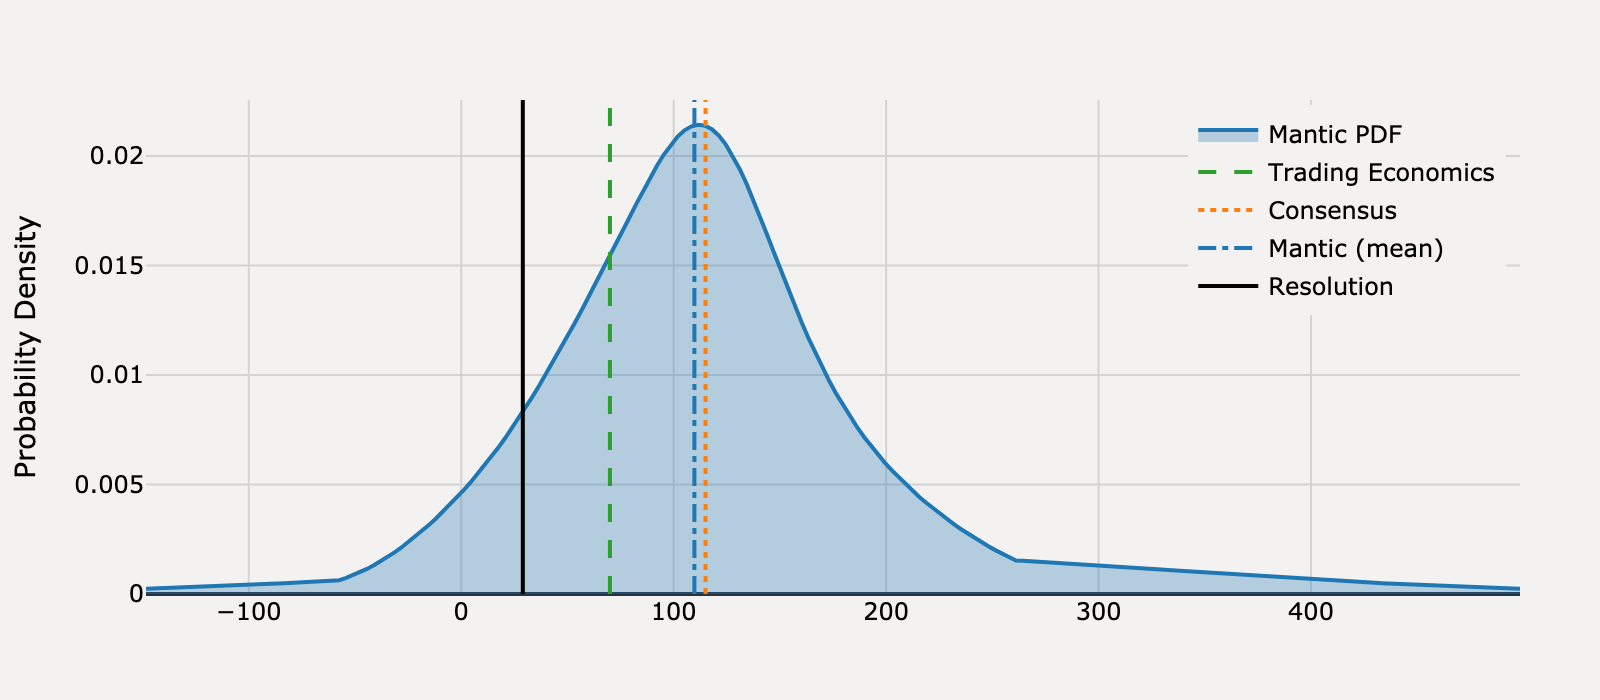
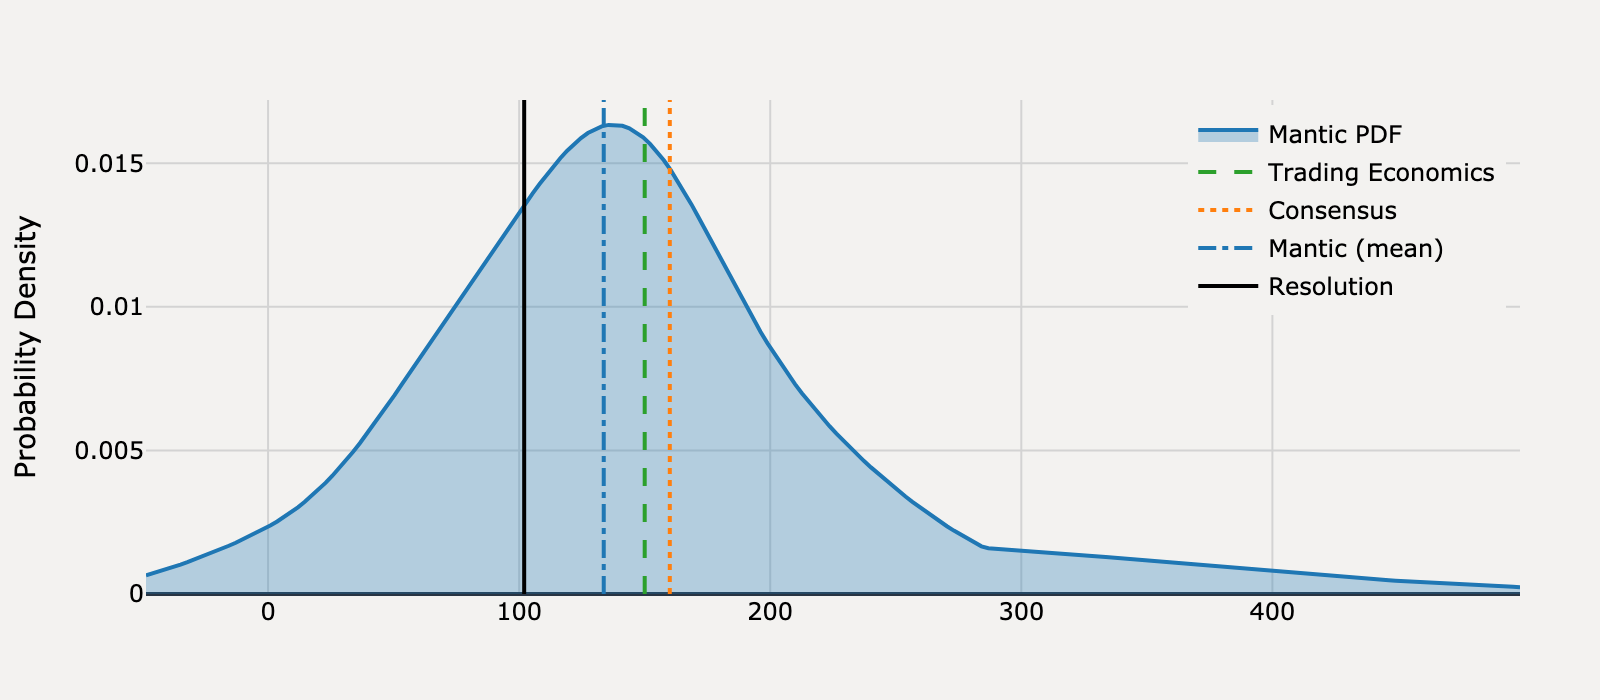
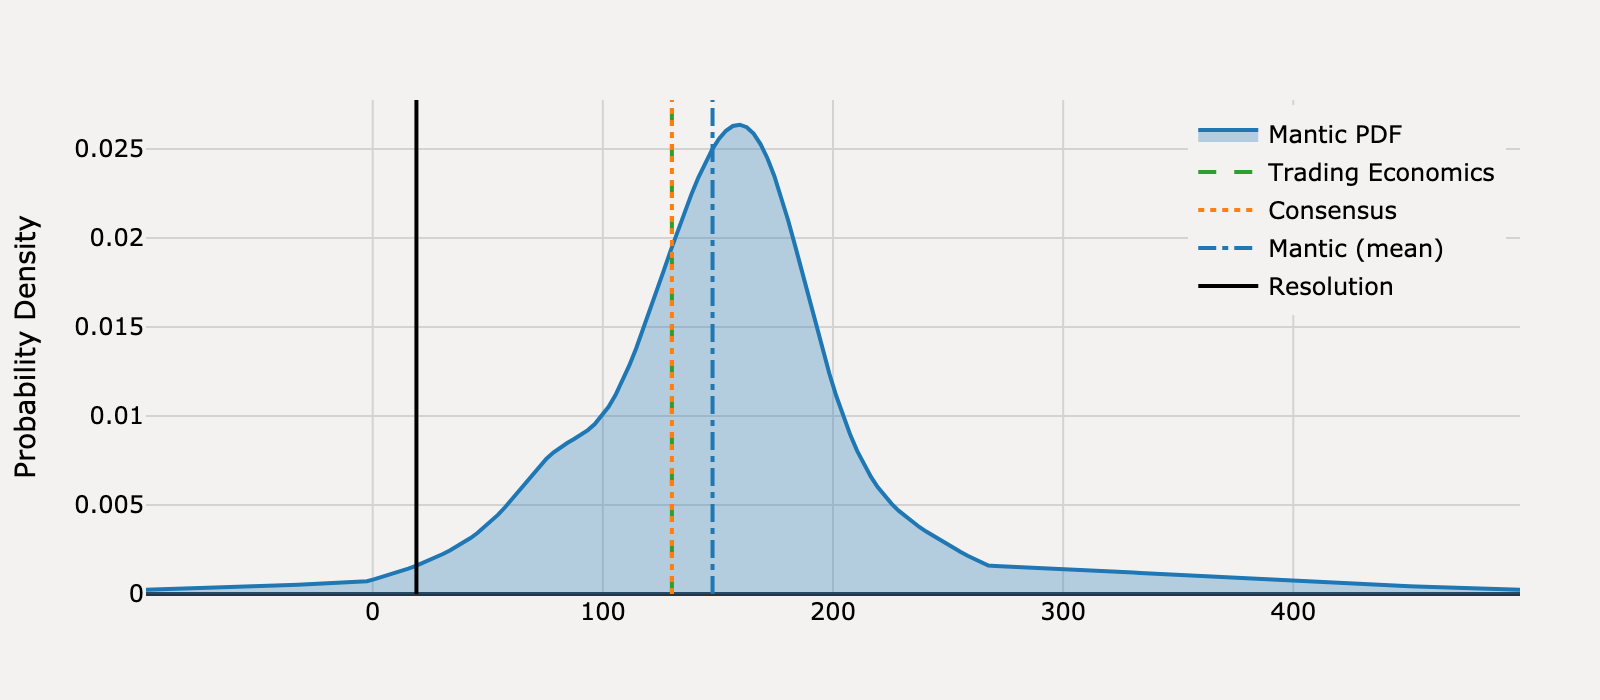
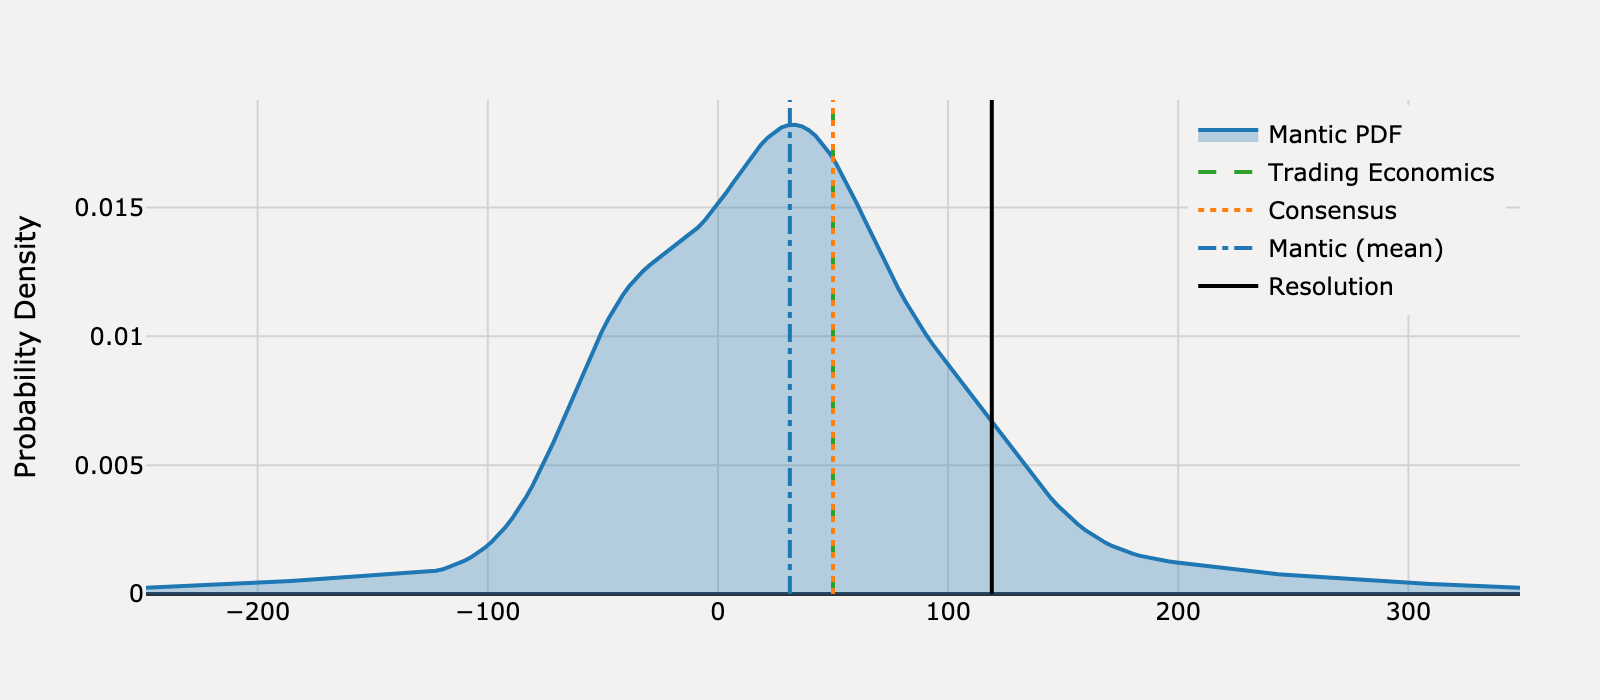
What will United States ADP Employment Change be for January 2025?
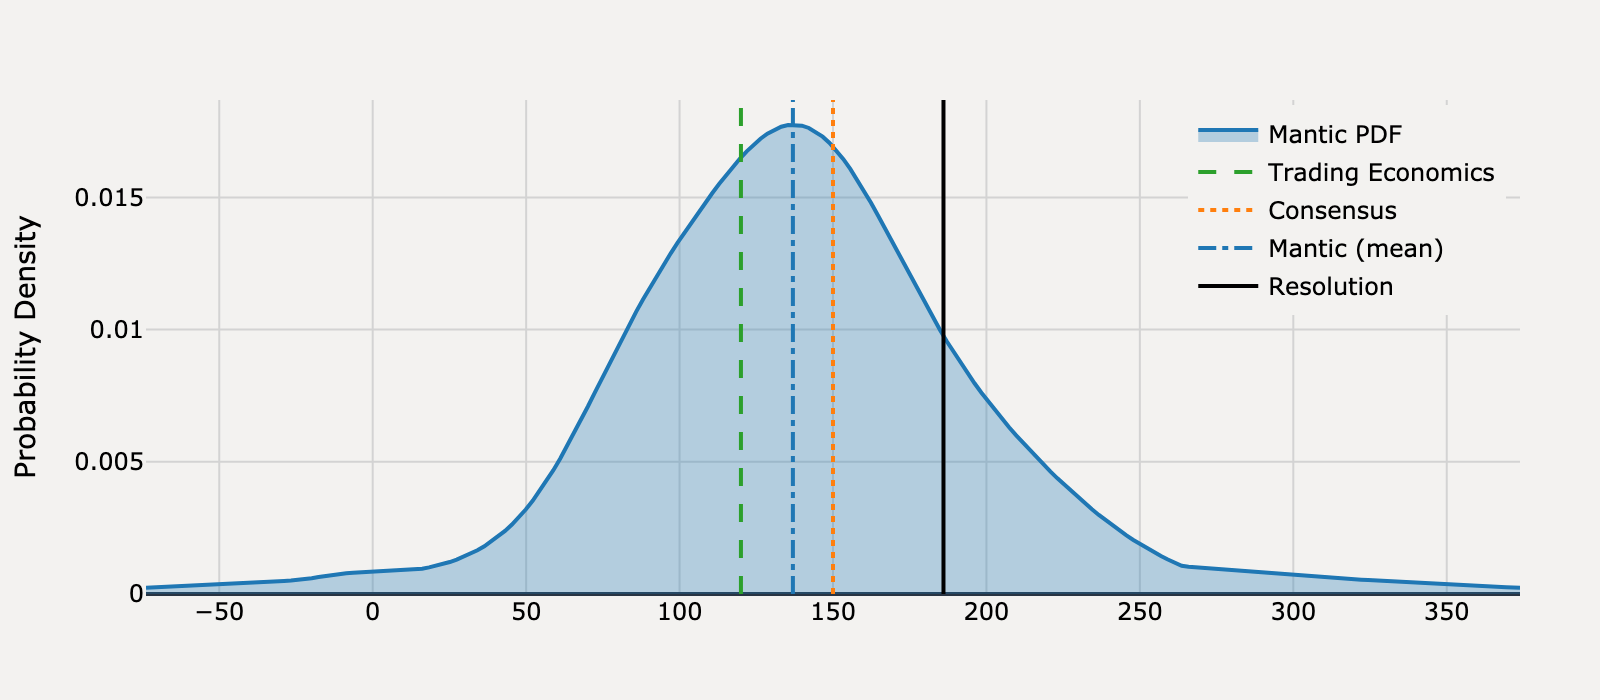
Actual Resolution: 186.0
Best RMSE: Consensus
Mantic (mean)
136.9
Trading Economics
120.0
Consensus
150.0BEST
RMSE
Mantic (mean)
2,408
Trading Economics
4,356
Consensus
1,296
View Mantic Prediction Analysis
- I estimate the United States ADP Employment Change for January 2025 at 138 thousand. The 50% confidence interval ranges from 101 thousand to 176 thousand.
- The forecast is centered above the December 2024 result of 122 thousand, which was below the 2024 monthly average gain of 155.5 thousand (FRED data).
- The S&P Global flash U.S. Composite PMI employment index jumped to 53.7 in January, its highest level in 2.5 years, suggesting renewed acceleration in private-sector hiring, particularly in services (Reuters).
- A significant counter-signal is the continuing unemployment claims, which reached a three-year high of 1.9 million in mid-January, indicating increasing difficulty for job seekers (MSN).
- Small business employment showed a year-over-year decline through October 2024 (Intuit QuickBooks Report), implying that the majority of job creation remains concentrated among large firms.
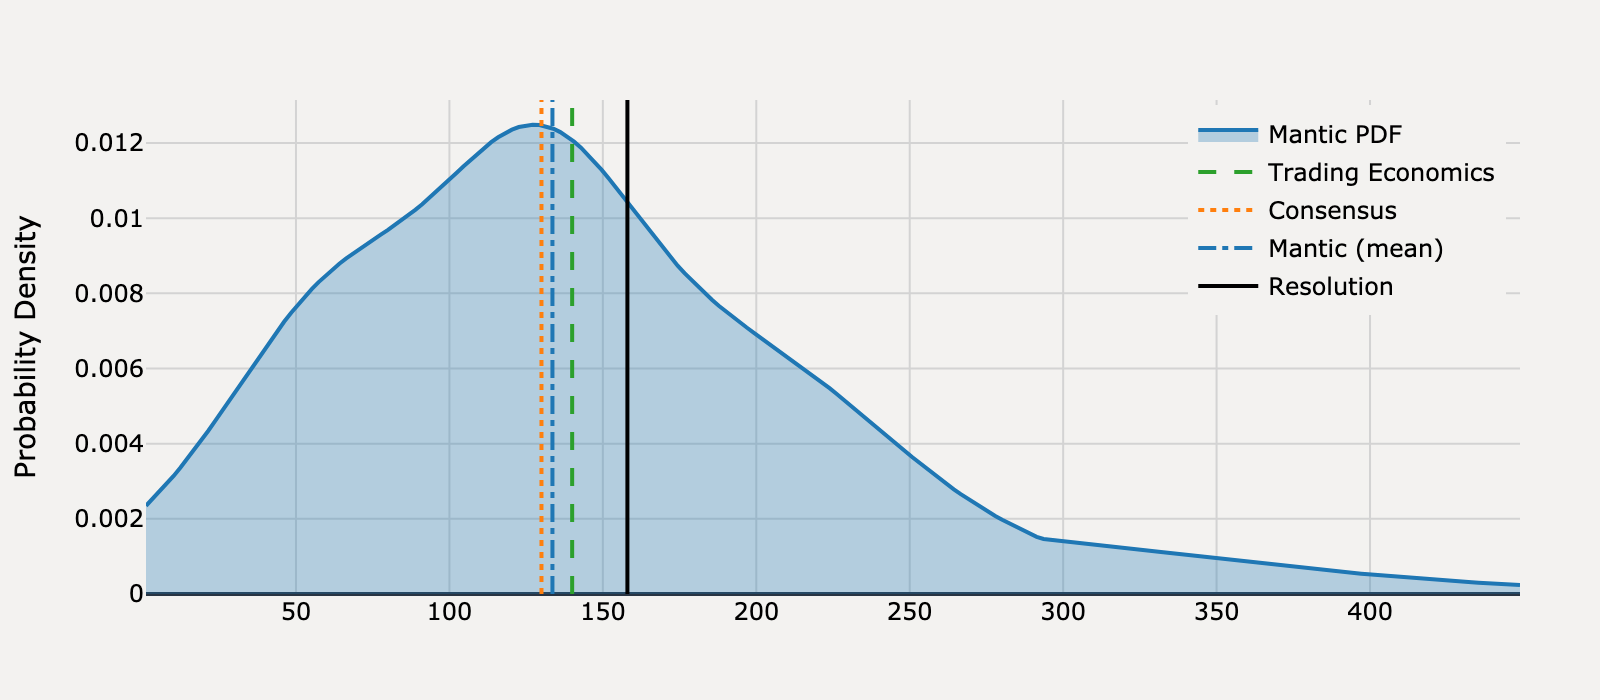
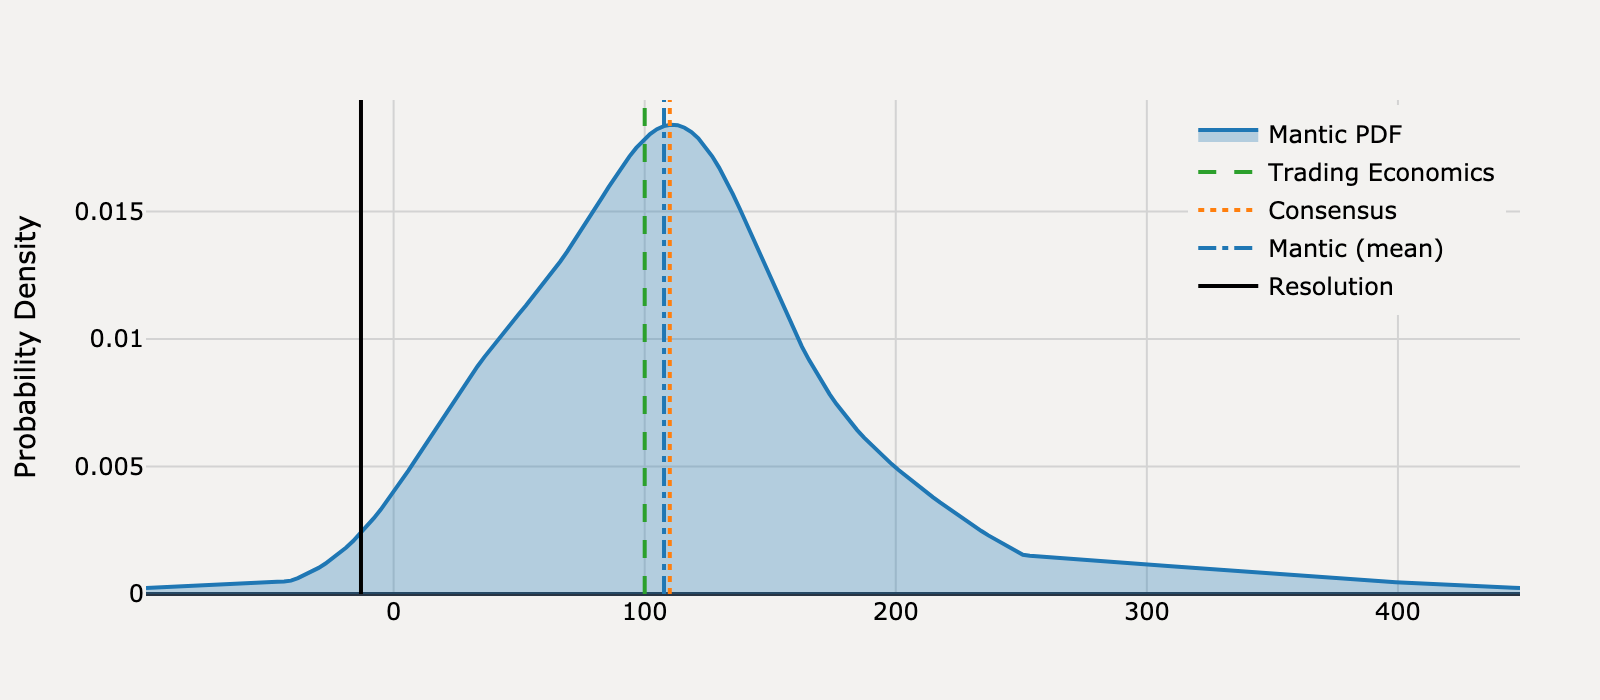
What will United States ADP Employment Change be for February 2025?
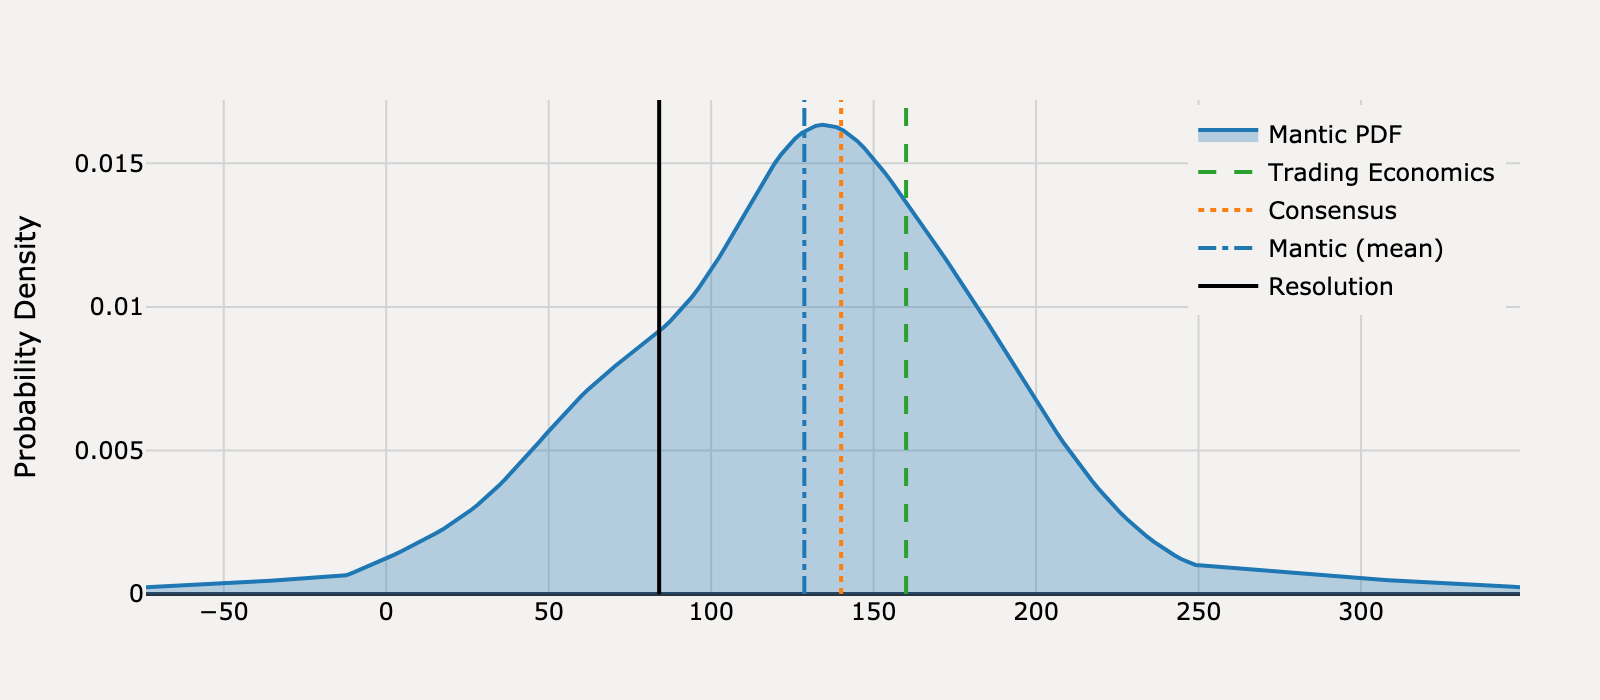
Actual Resolution: 84.00
Best RMSE: Mantic
Mantic (mean)
128.7BEST
Trading Economics
160.0
Consensus
140.0
RMSE
Mantic (mean)
1,996
Trading Economics
5,776
Consensus
3,136
View Mantic Prediction Analysis
- I forecast the United States ADP Employment Change for February 2025 at 132,000 jobs, with an 80% confidence interval spanning 45,300 to 209,000.
- This prediction represents a significant moderation from the 183,000 jobs reported in the ADP National Employment Report for January 2025.
- The primary downside risk is indicated by the S&P Global Flash U.S. Composite PMI employment index, which fell sharply to 49.4 in February, signifying a contraction in private sector employment.
- The forecast avoids a negative print because signals like Initial Jobless Claims remain relatively contained, and staffing firms report modest sequential improvement in volumes in early 2025.
- The expected slowdown incorporates the effect of political uncertainty and fears of federal workforce reductions, which likely caused companies to pause hiring, particularly private-sector federal contractors.
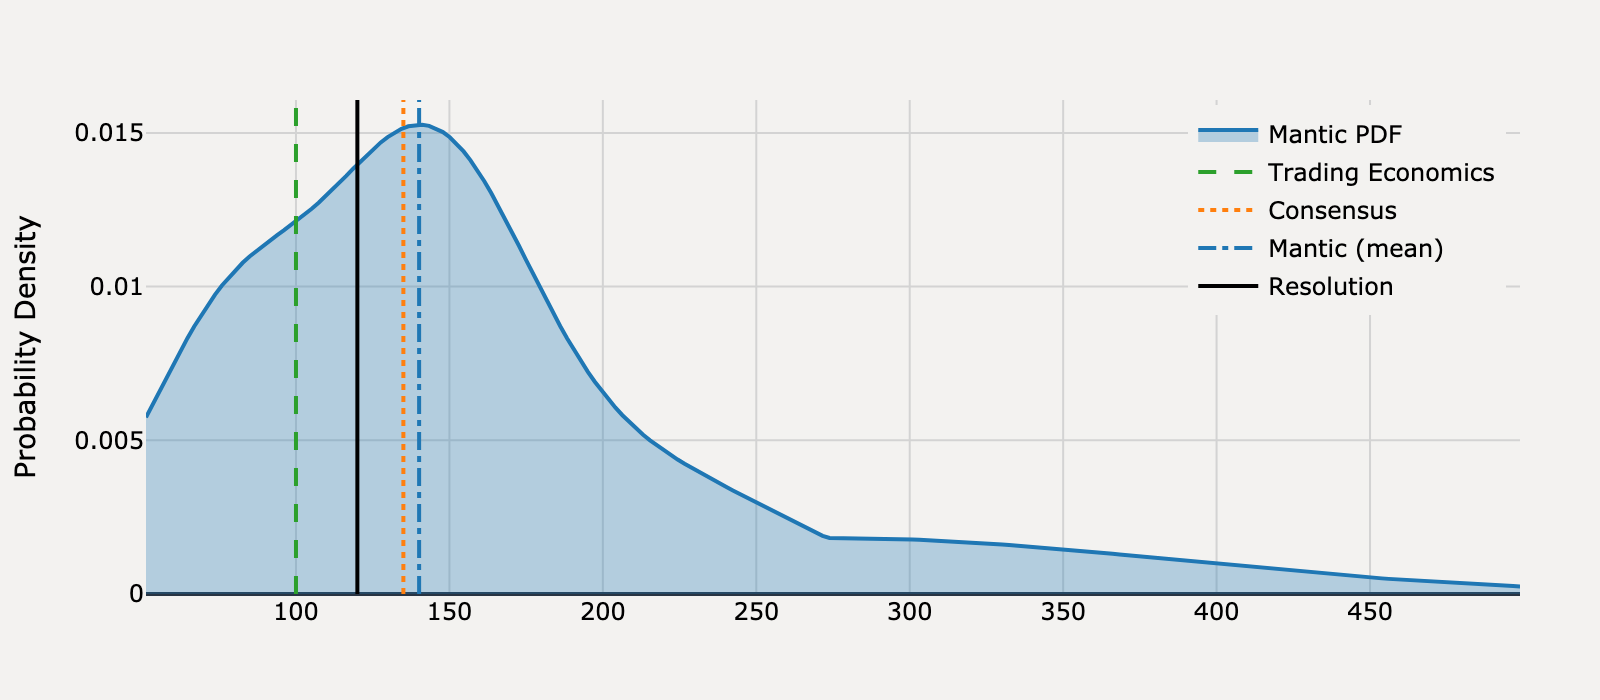
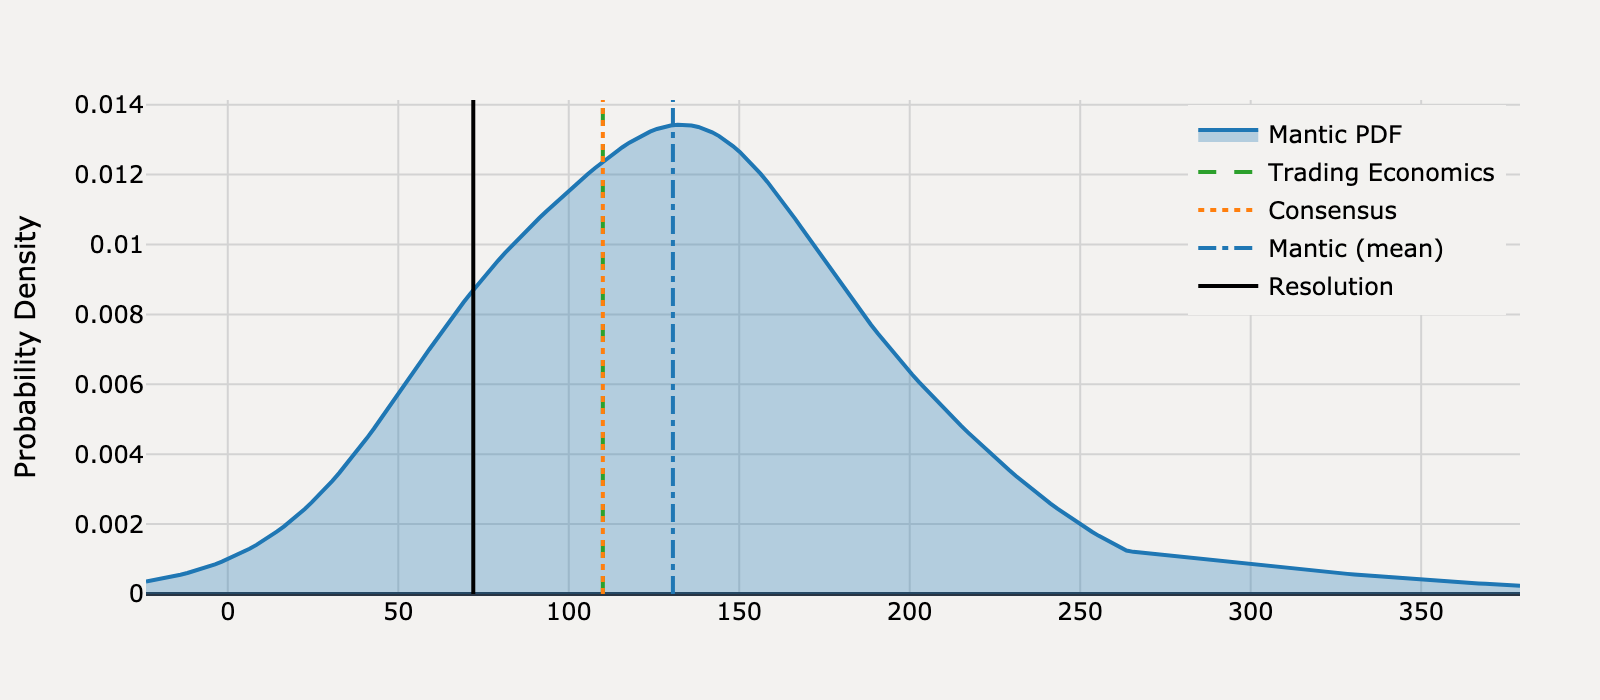
What will United States ADP Employment Change be for March 2025?
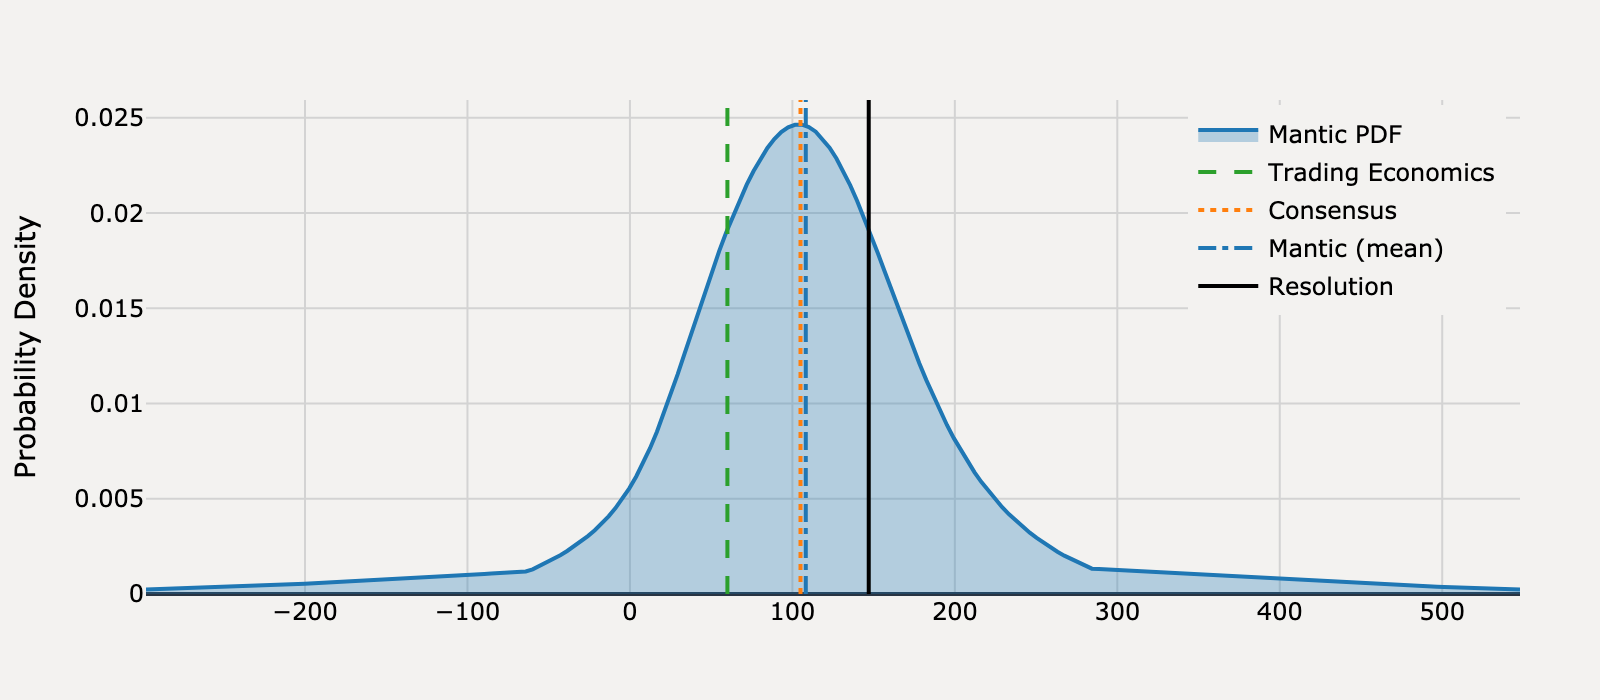
Actual Resolution: 147.0
Best RMSE: Mantic
Mantic (mean)
108.2BEST
Trading Economics
60.00
Consensus
105.0
RMSE
Mantic (mean)
1,502
Trading Economics
7,569
Consensus
1,764
View Mantic Prediction Analysis
- I forecast the United States ADP Employment Change for March 2025 to be 107 thousand jobs.
- The forecast reflects a continued cooling trend following the February 2025 figure of 77 thousand, which was the smallest gain since July.
- Significant downside pressure stems from weakening business confidence due to policy shocks, including new tariffs that caused small-business CEO outlook to plummet.
- The Conference Board Consumer Expectations Index for March dropped to 65.2, its lowest level in 12 years, signaling broad pessimism about future job prospects.
- Continued expansion in the service sector, reflected by the S&P Global Composite PMI Output Index rising to 53.5, provides an offset, keeping job growth positive.
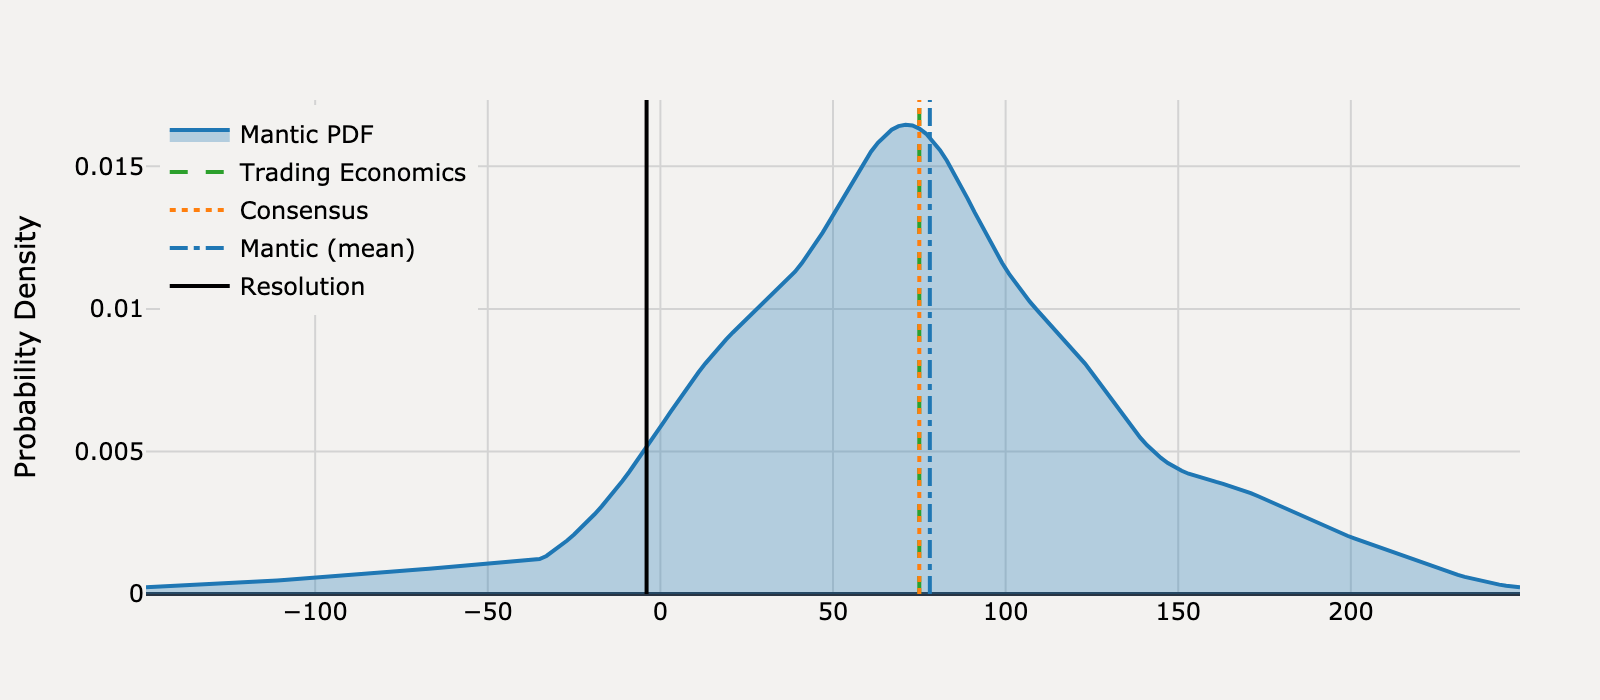
What will United States ADP Employment Change be for April 2025?
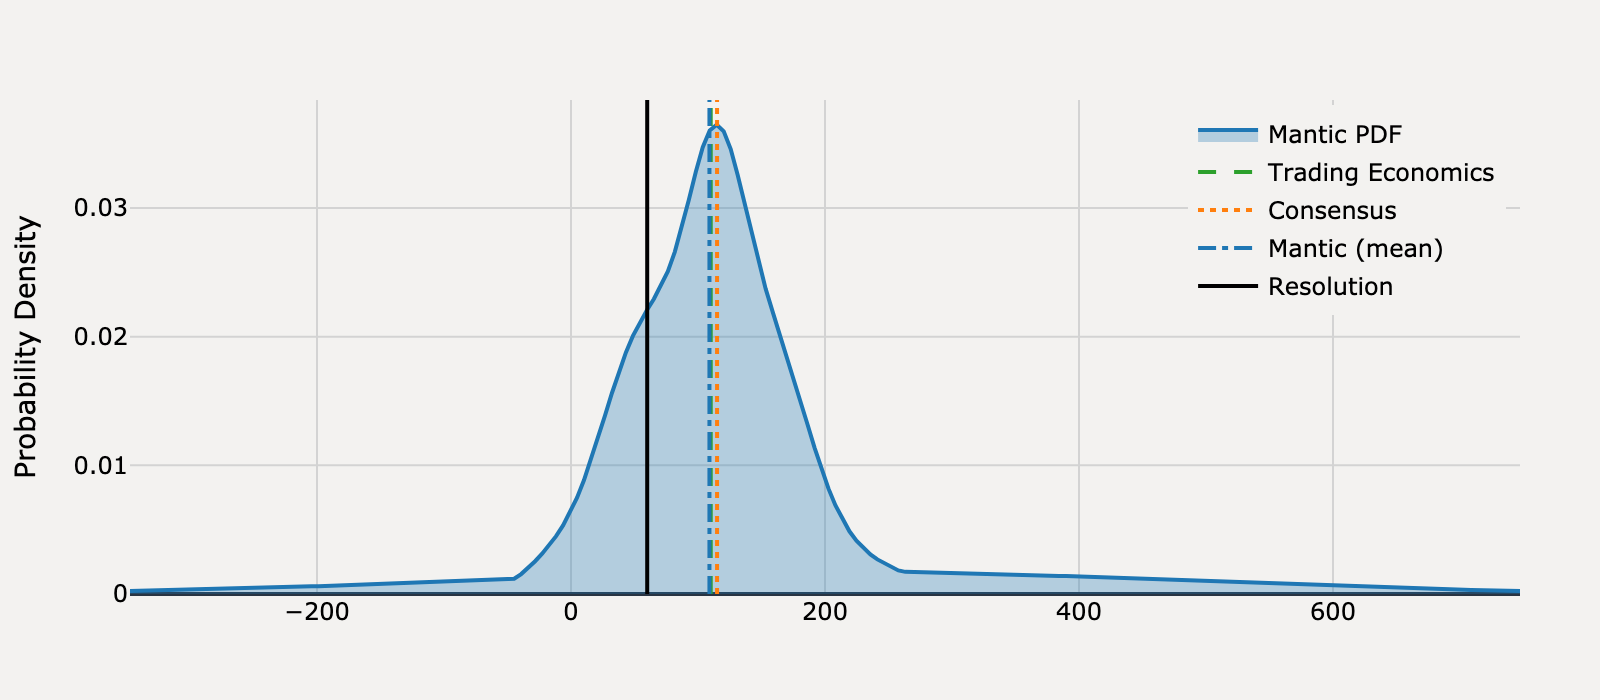
Actual Resolution: 60.00
Best RMSE: Mantic
Mantic (mean)
109.0BEST
Trading Economics
110.0
Consensus
115.0
RMSE
Mantic (mean)
2,401
Trading Economics
2,500
Consensus
3,025
View Mantic Prediction Analysis
- I forecast the United States ADP Employment Change for April 2025 to be 112 thousand, with an interquartile range spanning 63 thousand to 161 thousand.
- This forecast is below the market consensus of 115 thousand, primarily driven by a sharp deterioration in business sentiment following new tariffs announced in early April.
- Regional Federal Reserve surveys confirm this shock, with the Philadelphia Fed Manufacturing Index plummeting to -26 in April, its lowest level since April 2023.
- Surveys of U.S. business leaders indicate a reaction to uncertainty, with over 40% slowing hiring efforts or implementing a hiring freeze.
- Despite these significant headwinds, the forecast remains positive due to the labor market's historical resilience and stable initial jobless claims, which continue to hover around 222 thousand.
What will United States ADP Employment Change be for May 2025?
Actual Resolution: 29.00
Best RMSE: Trading Economics
Mantic (mean)
109.8
Trading Economics
70.00BEST
Consensus
115.0
RMSE
Mantic (mean)
6,524
Trading Economics
1,681
Consensus
7,396
View Mantic Prediction Analysis
- I forecast the United States ADP Employment Change for May 2025 will be 111 thousand jobs, with a 50% confidence interval spanning 66 thousand to 159 thousand.
- The median forecast anticipates a rebound from the April 2025 ADP reading of 62 thousand, an anomalous low point especially when compared to the 177 thousand nonfarm payroll jobs added that month.
- The 2025 ADP data exhibits a volatile 'zig-zag' pattern with generally lower peaks and troughs (e.g., 186K in January; 62K in April), indicating an underlying trend of cooling job growth.
- Broader labor market indicators, such as the persistent decline in job vacancies (7.19 million in March 2025), confirm that demand for labor is weakening.
- Significant downside risk remains, reflected by the 25th percentile at 66 thousand, due to continued economic uncertainty, corporate cost-cutting, and trade policy effects on business hiring.
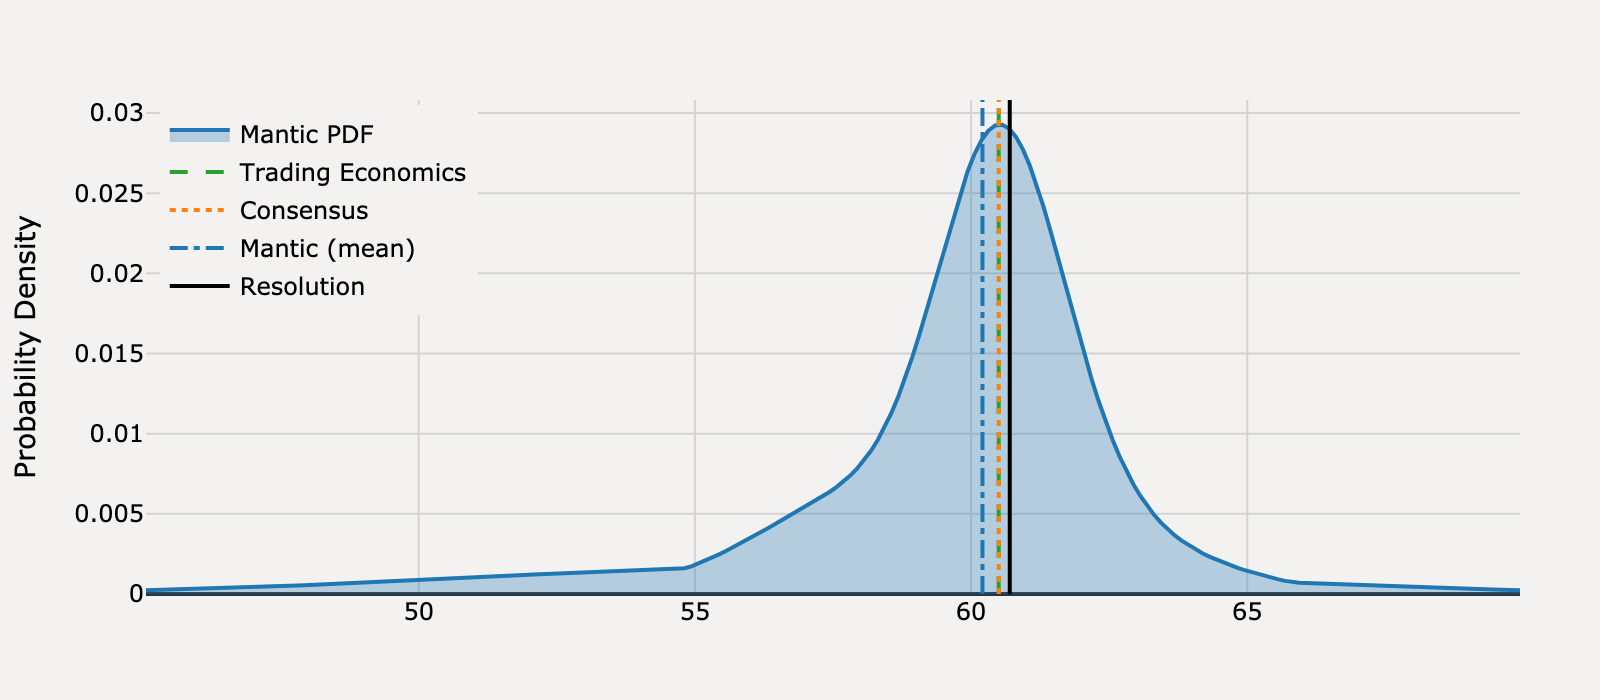
What will United States ADP Employment Change be for June 2025?
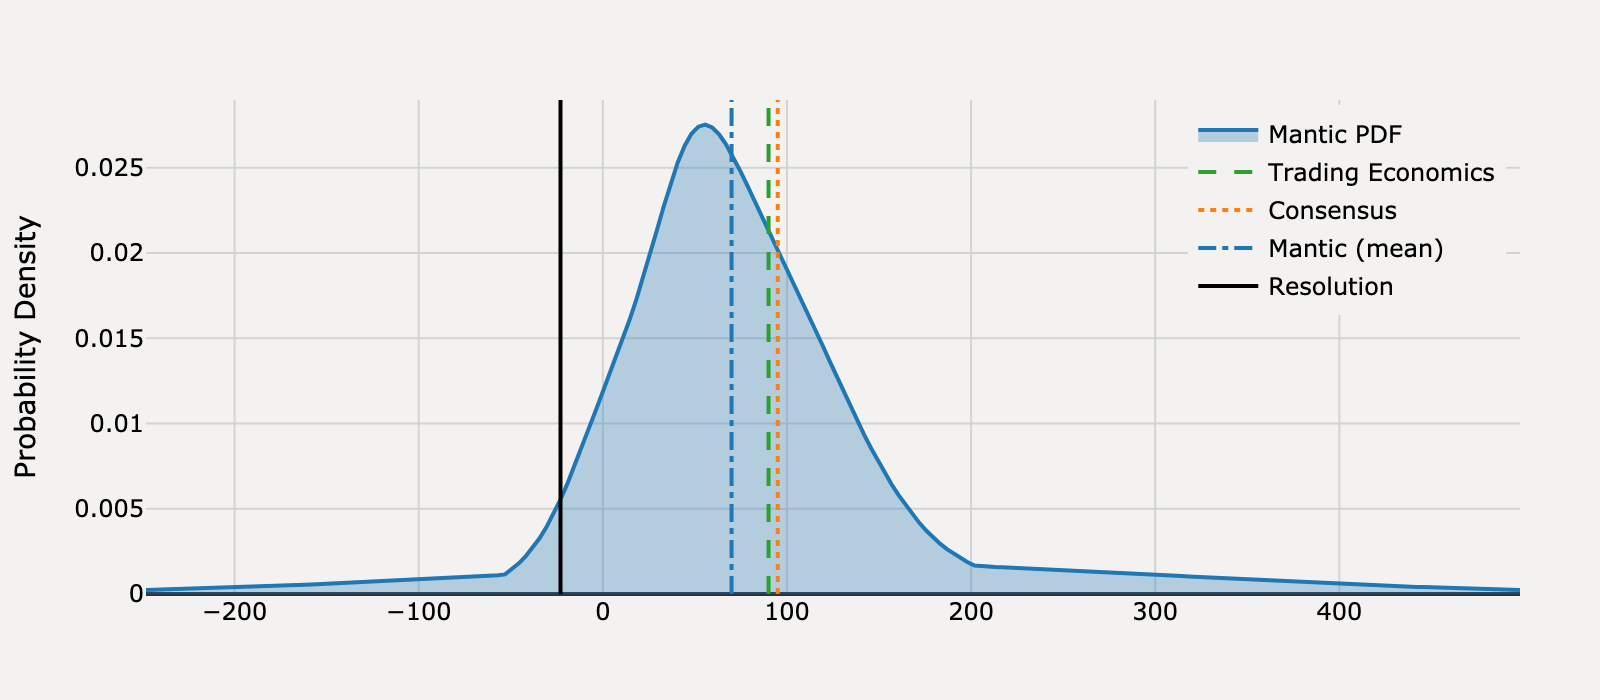
Actual Resolution: -23.00
Best RMSE: Mantic
Mantic (mean)
69.91BEST
Trading Economics
90.00
Consensus
95.00
RMSE
Mantic (mean)
8,632
Trading Economics
12,769
Consensus
13,924
View Mantic Prediction Analysis
- My median forecast for the US ADP Employment Change in June 2025 is 67.5 thousand jobs, with a 50% confidence interval ranging from 29.4K to 114K.
- The forecast reflects a significant and persistent deceleration in private sector hiring, following a sharp drop to +37K in May (Yahoo News) and +60K in April.
- Leading indicators corroborate the cooling, with Initial Jobless Claims rising to approximately 250K in early June and the Conference Board's labor market differential falling to a four-year low.
- The expected figure aligns with the estimated new structural "breakeven" job growth rate of 60K to 70K, which is lowered due to reduced migrant worker inflows (Barclays via Reuters).
- The forecast’s 80% confidence interval spans -10.9K to 186K, acknowledging the risk of a slight net contraction given the sharp drop in consumer confidence and rising recession expectations.
What will United States ADP Employment Change be for July 2025?
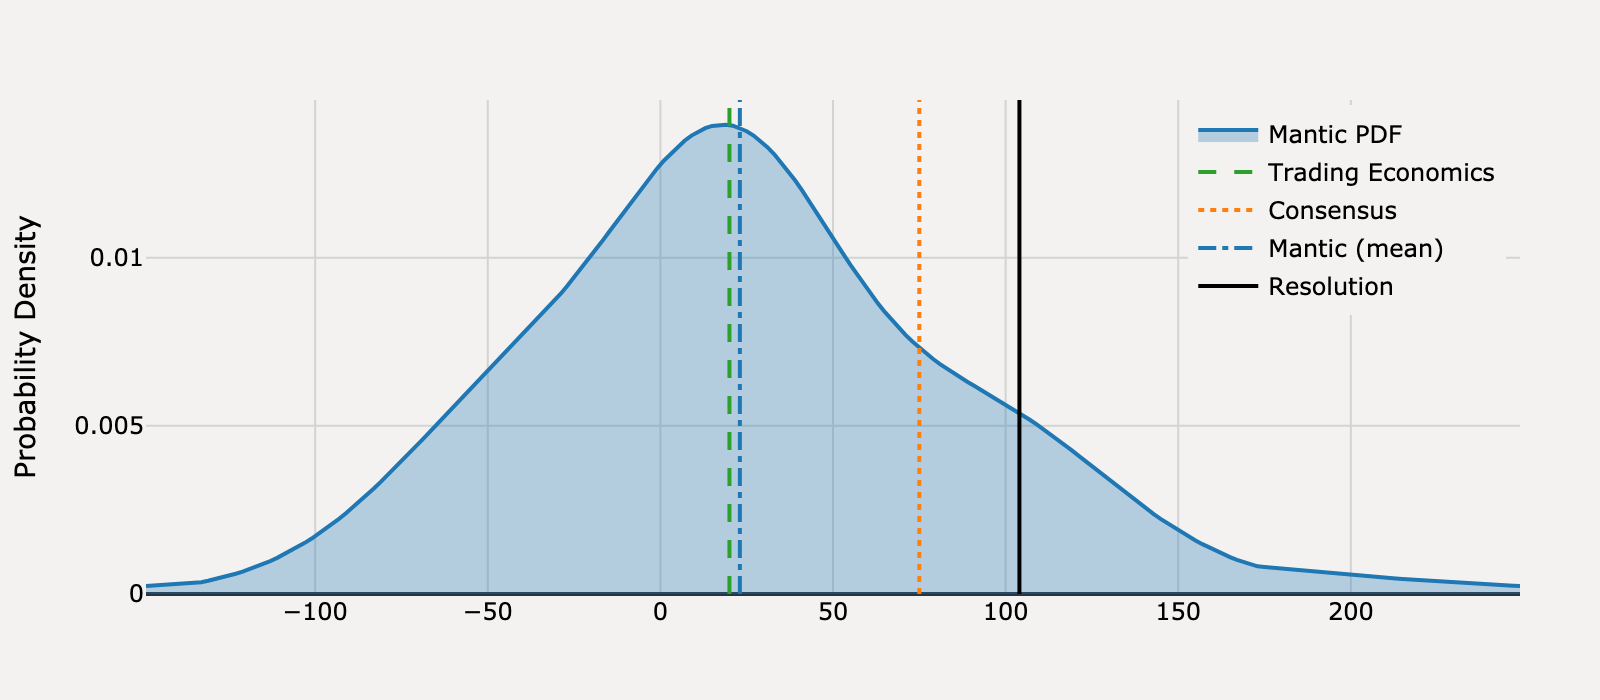
Actual Resolution: 104.0
Best RMSE: Consensus
Mantic (mean)
23.02
Trading Economics
20.00
Consensus
75.00BEST
RMSE
Mantic (mean)
6,558
Trading Economics
7,056
Consensus
841.0
View Mantic Prediction Analysis
- I predict the US ADP Employment Change for July 2025 will be 20.7 thousand. The 50% confidence interval spans from -21.4 thousand to 67.2 thousand.
- The forecast is heavily constrained by the June 2025 figure, which reported a net loss of 33.0 thousand private sector jobs, a significant reversal from prior months.
- The modest positive expectation incorporates the possibility that the June figure was a statistical anomaly, given the official BLS Non-Farm Payrolls reported a gain of 147 thousand jobs for the same month.
- Downside risk remains high due to reports of surging corporate layoffs and a continued structural decline in the U.S. Leading Economic Index.
- ADP's own earnings guidance anticipates that internal employee growth rates will remain at "below normal levels" for the upcoming fiscal year, reinforcing the expectation of a stagnant labor market.
What will United States ADP Employment Change be for August 2025?
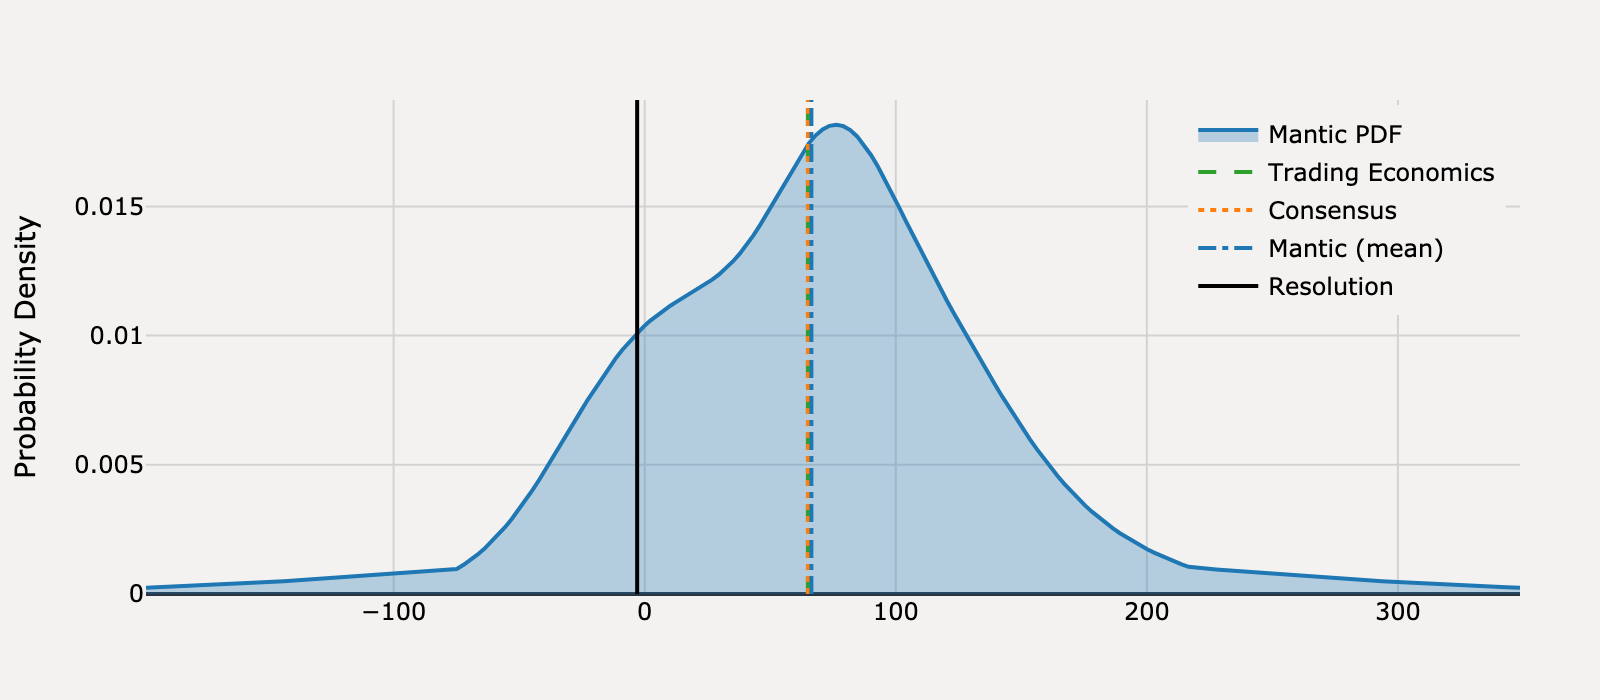
Actual Resolution: -3.00
Best RMSE: Trading Economics, Consensus
Mantic (mean)
66.39
Trading Economics
65.00TIE
Consensus
65.00TIE
RMSE
Mantic (mean)
4,815
Trading Economics
4,624
Consensus
4,624
View Mantic Prediction Analysis
- I forecast the United States ADP Employment Change for August 2025 to be 67.9 thousand jobs.
- The 80% confidence interval for the forecast ranges from 16.3 thousand (25th percentile) to 162 thousand (90th percentile), reflecting extreme recent volatility.
- The forecast is substantially lower than the July print of 104 thousand and the 7-month average of 84 thousand, continuing the deceleration trend since early 2025.
- Downside risk is high due to severely deteriorating August-specific leading indicators, including the ISM Manufacturing employment component falling to 43.4.
- Consumer confidence concerning job availability declined for the eighth consecutive month in August, suggesting rising pessimism that should temper hiring.
What will United States ADP Employment Change be for September 2025?
Actual Resolution: -29.00
Best RMSE: Mantic
Mantic (mean)
37.02BEST
Trading Economics
40.00
Consensus
50.00
RMSE
Mantic (mean)
4,359
Trading Economics
4,761
Consensus
6,241
View Mantic Prediction Analysis
- I forecast the ADP Employment Change for September 2025 will be 42.7 Thousand private jobs added.
- The 50% confidence interval ranges from a small job loss of -5.89 Thousand to a gain of 87.8 Thousand, reflecting high volatility and significant downside risk.
- The labor market trend is cooling rapidly, with job growth falling to 54 Thousand in August and a job contraction of -23 Thousand recorded in June 2025.
- Leading indicators signal severe weakness, notably Initial Jobless Claims surging to a four-year high of 264 Thousand in early September.
- The fundamental weakness is confirmed by the annual nonfarm payroll revisions, which cut 911 Thousand jobs from prior estimates through March 2025.
What will United States ADP Employment Change be for October 2025?

Actual Resolution: 47.00
Best RMSE: Mantic
Mantic (mean)
48.39BEST
Trading Economics
20.00
Consensus
25.00
RMSE
Mantic (mean)
1.93
Trading Economics
729.0
Consensus
484.0
View Mantic Prediction Analysis
- The median forecast for the United States ADP Employment Change in October 2025 is +50.3 Thousand, with a 50% confidence interval spanning +10.0 Thousand to +88.2 Thousand.
- This central estimate is strongly anchored by a new ADP high-frequency measure, which suggested a gain of approximately +55 Thousand for October.
- The forecast follows two consecutive months of near-zero or negative ADP prints, including a contraction of -32 Thousand in September, which reflects ongoing labor market cooling.
- The predicted +50.3 Thousand is significantly higher than the external market consensus forecast of +25 Thousand, prioritizing the source's internal high-frequency data signal.
- The labor market's long-term average gain remains approximately +96 Thousand per month over the last 12 months, indicating a potential for a higher reading if recent weakness proves transitory.
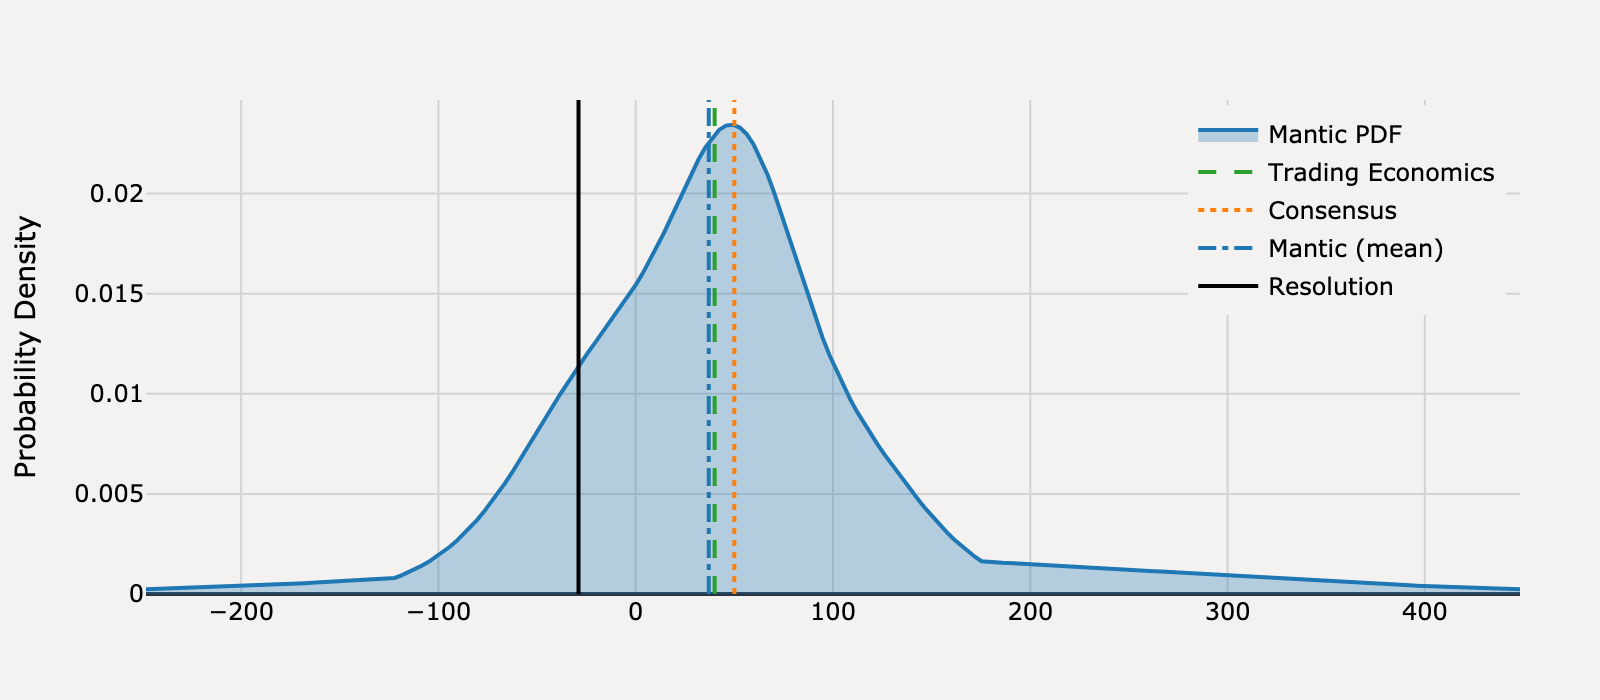
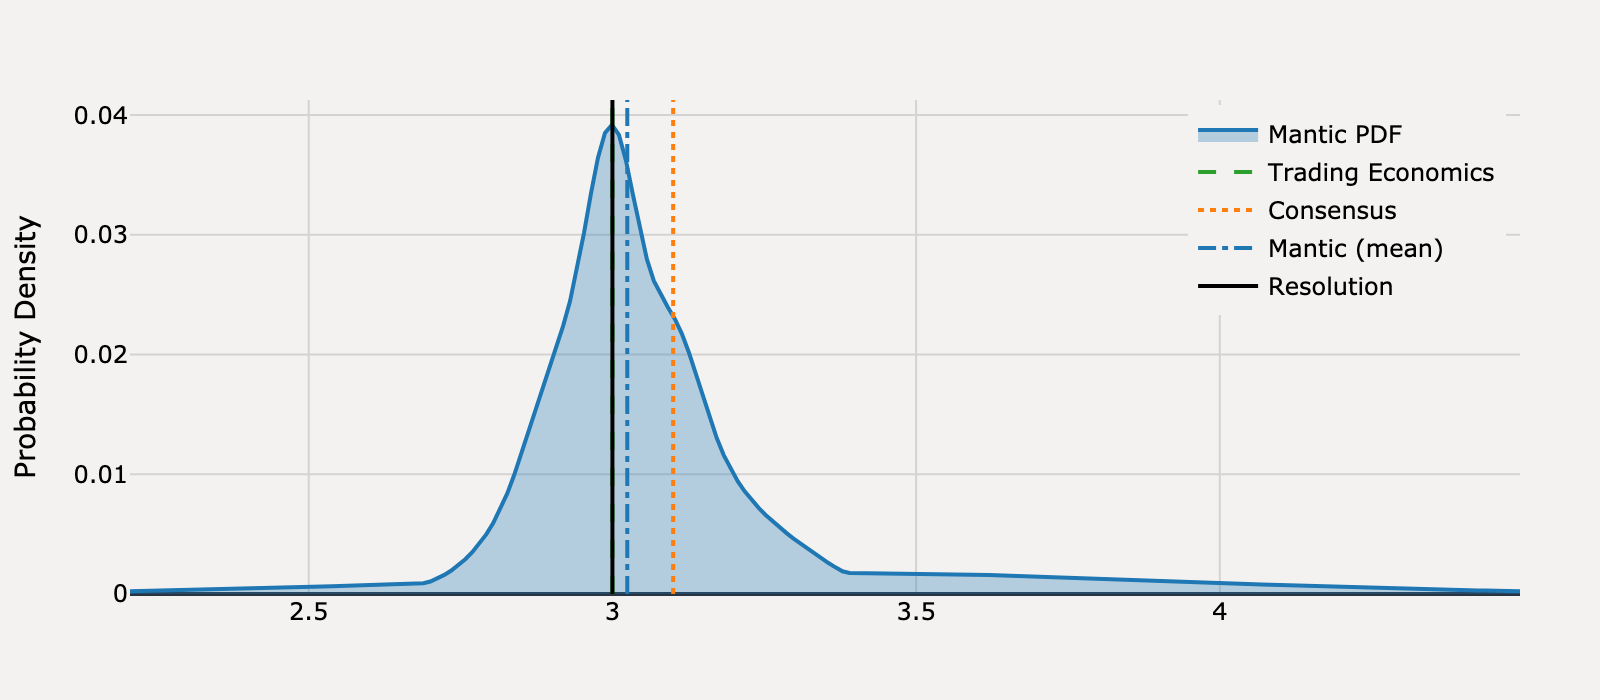
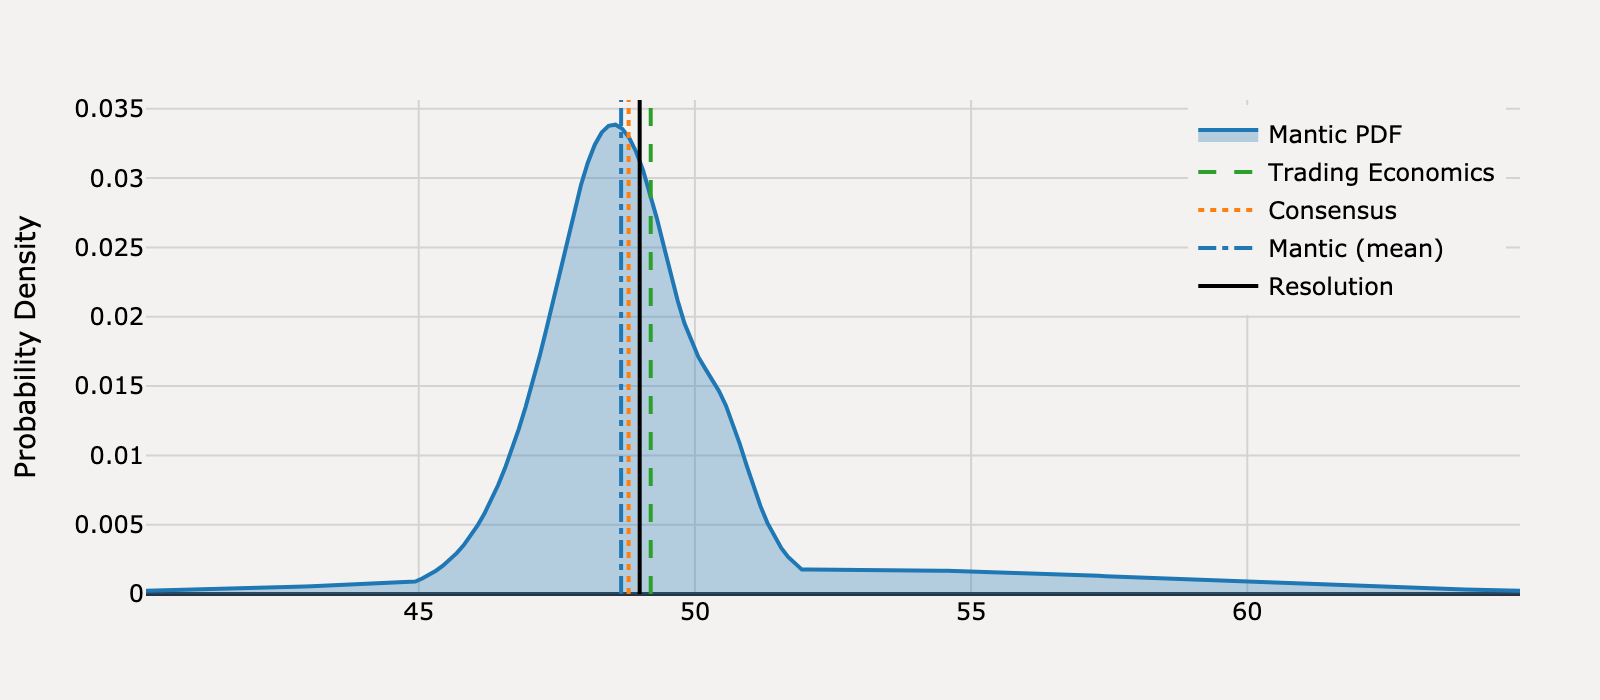
What will United States Core Inflation Rate be for January 2025?
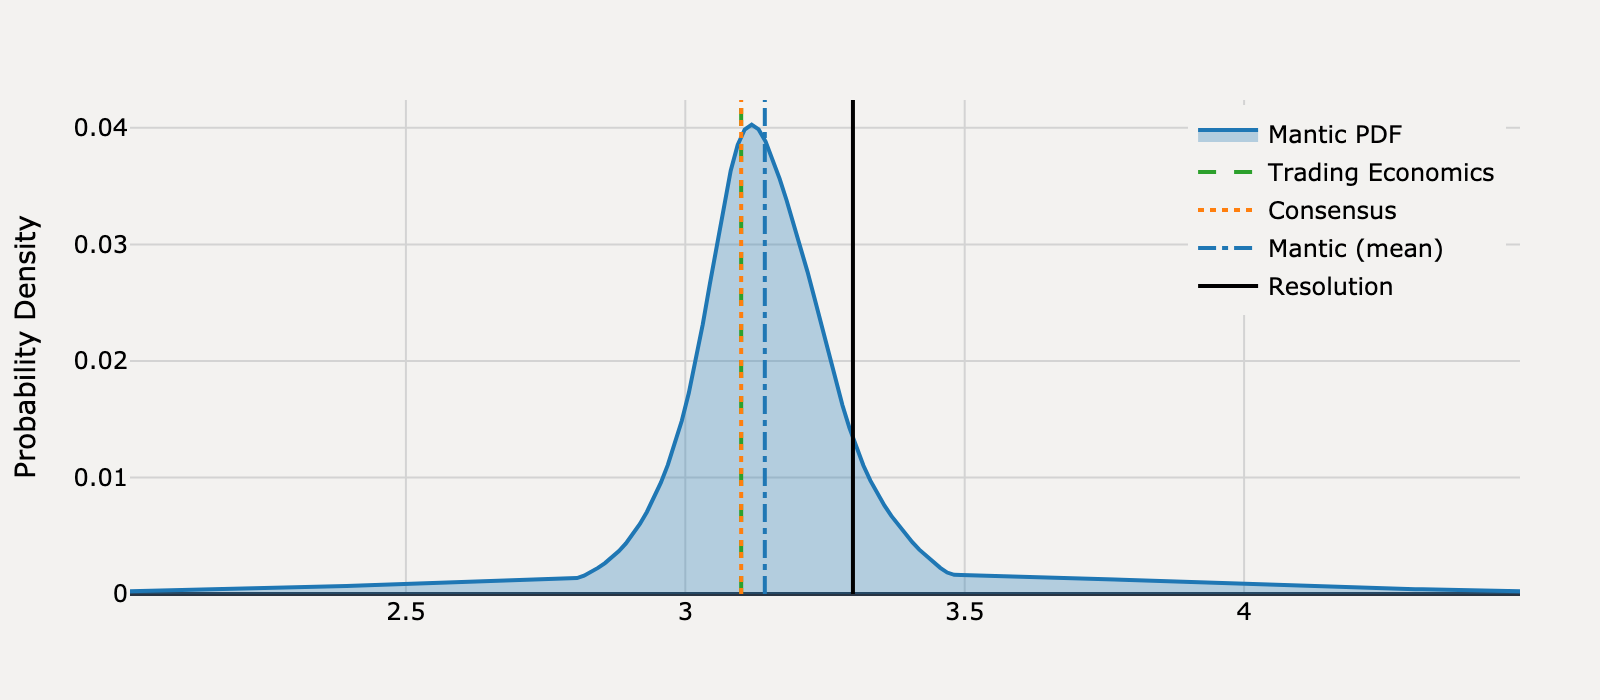
Actual Resolution: 3.30
Best RMSE: Mantic
Mantic (mean)
3.14BEST
Trading Economics
3.10
Consensus
3.10
RMSE
Mantic (mean)
0.025
Trading Economics
0.04
Consensus
0.04
View Mantic Prediction Analysis
- I forecast the United States Core Inflation Rate for January 2025 will be 3.14%, with a 50% confidence interval spanning 3.05% to 3.25%.
- The primary driver for the expected decrease from the December 2024 rate of 3.2% is a base effect, as the high monthly increase from January 2024 drops out of the year-over-year calculation.
- The rate is constrained by persistent inflationary pressure indicated by the January 2025 ISM Prices Paid index surging to 54.9, an eight-month high for manufacturer input costs.
- Disinflationary factors are supported by the sharp appreciation of the US Dollar against the Euro and Yen through January 2025, which reduces the cost of imported goods.
- The forecast accounts for upside risks from typical January price resets (residual seasonality) and specific reports citing the California wildfires as a temporary inflationary driver for used vehicles and lodging.
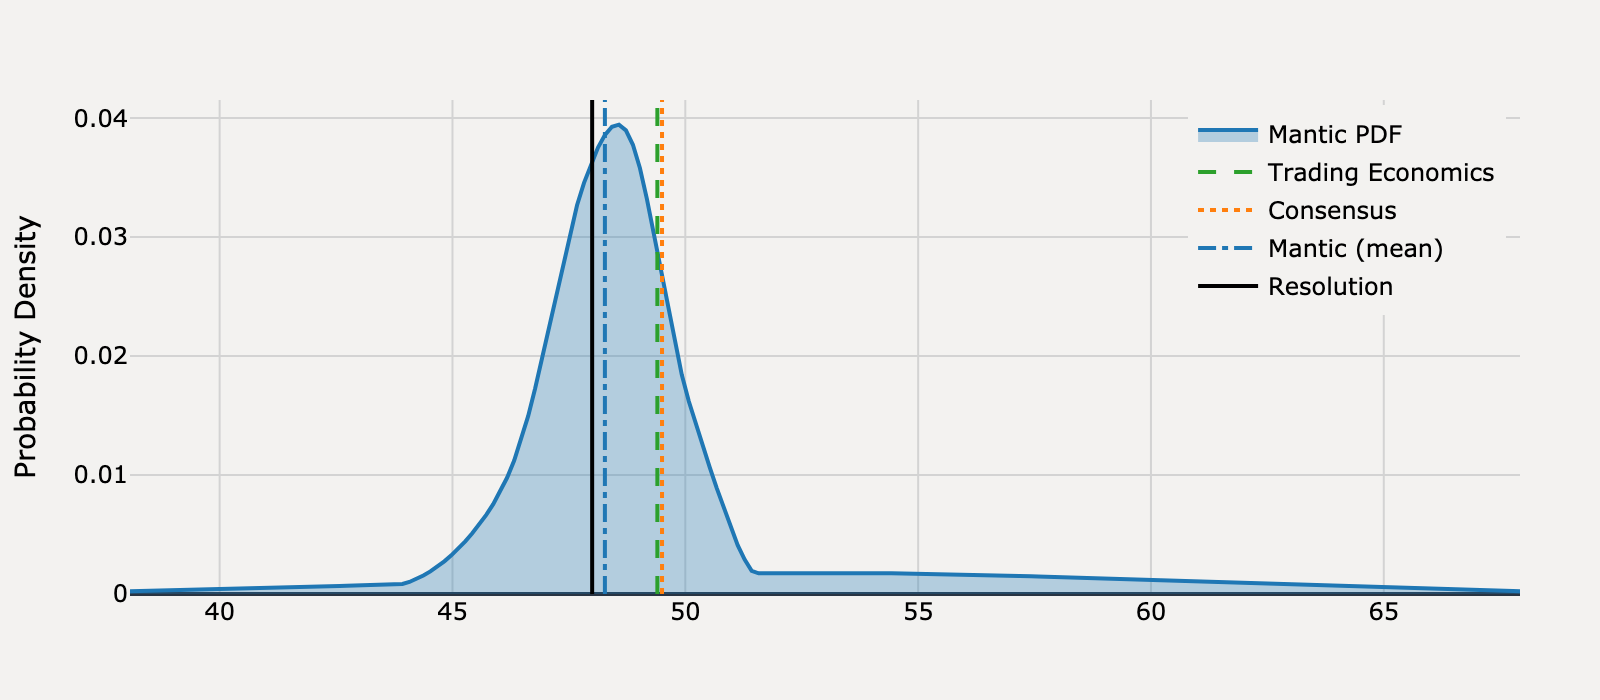
What will United States Core Inflation Rate be for February 2025?

Actual Resolution: 3.10
Best RMSE: Trading Economics
Mantic (mean)
3.24
Trading Economics
3.10BEST
Consensus
3.20
RMSE
Mantic (mean)
0.019
Trading Economics
0
Consensus
0.01
View Mantic Prediction Analysis
- I place the median forecast for the United States Core Inflation Rate (YoY) for February 2025 at 3.23%. The 50% confidence interval spans 3.17% to 3.32%.
- A mechanical downward shift is anticipated due to favorable base effects, as the high 0.36% Core CPI month-over-month print from February 2024 drops out of the year-over-year calculation.
- Current nowcasts for the February 2025 month-over-month Core CPI are centered between 0.27% (Cleveland Fed) and 0.30% (market consensus), supporting a deceleration to a final year-over-year rate of 3.2%.
- Upside risk persists due to the strong 0.45% month-over-month Core CPI print in January 2025 and continued stickiness in services components like shelter and auto insurance.
- The ongoing growth in Average Hourly Earnings, at approximately 4% annualized through January 2025, supports sustained inflationary pressure in the service sector.
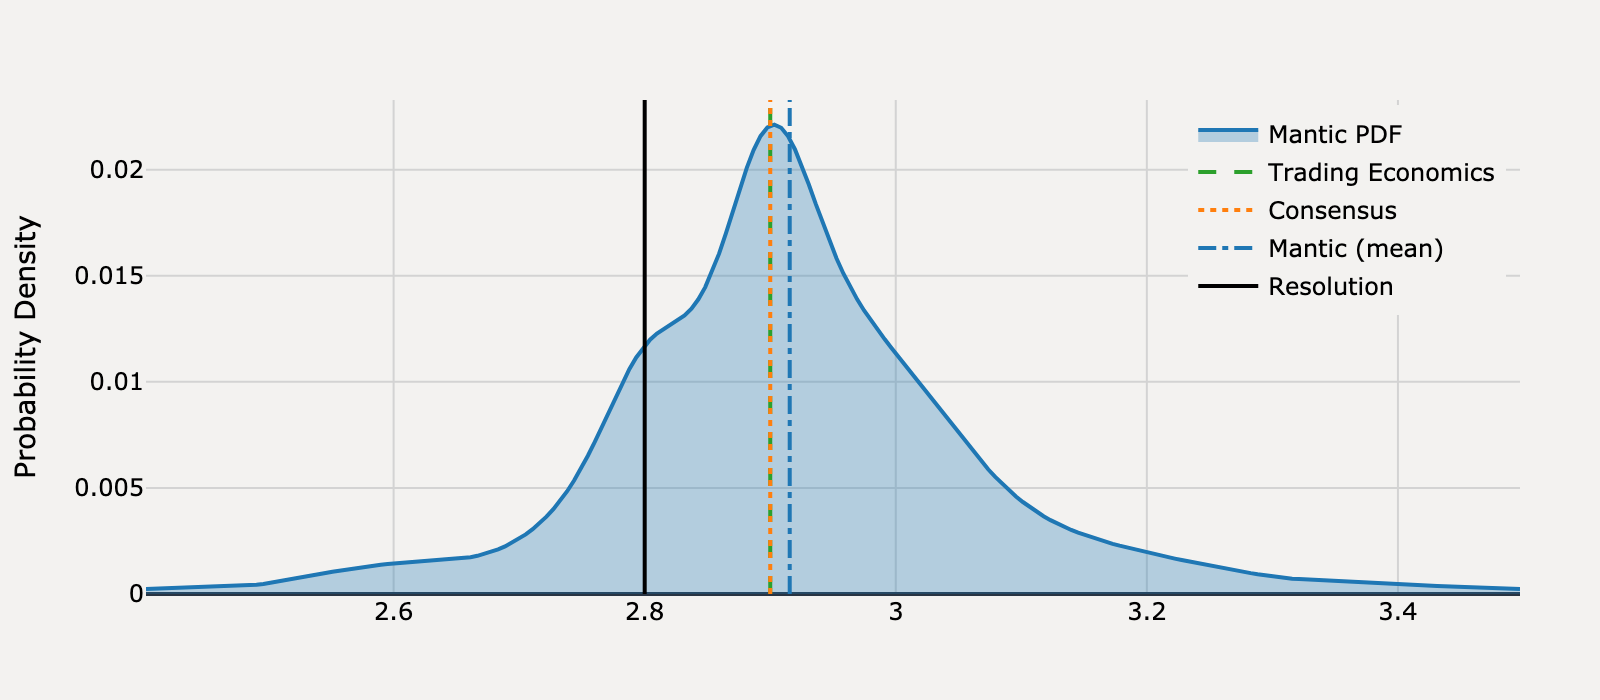
What will United States Core Inflation Rate be for March 2025?
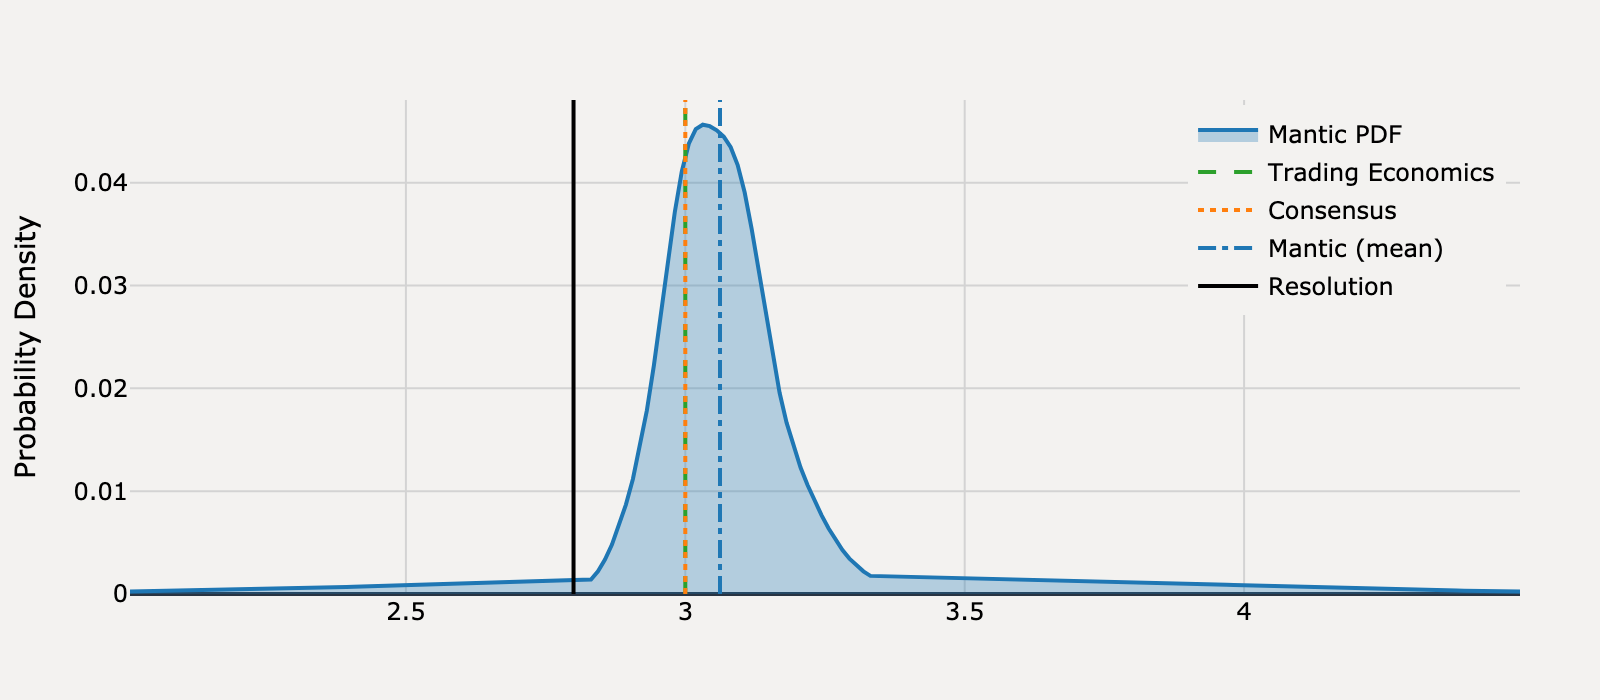
Actual Resolution: 2.80
Best RMSE: Trading Economics, Consensus
Mantic (mean)
3.06
Trading Economics
3.00TIE
Consensus
3.00TIE
RMSE
Mantic (mean)
0.069
Trading Economics
0.04
Consensus
0.04
View Mantic Prediction Analysis
- My median forecast for the US Core Inflation Rate (YoY CPI excluding food and energy) for March 2025 is 3.06%, with a 50% confidence interval spanning 2.99% to 3.15%.
- The Core Inflation Rate for February 2025 was 3.14%, continuing a steady disinflationary trend.
- The primary mechanical driver of the expected drop is the high base effect, as the strong March 2024 Core CPI monthly increase of approximately 0.38% drops out of the year-over-year calculation.
- The consensus expected monthly increase for March 2025 is 0.2% to 0.3%, which, due to the base effect, results in a year-over-year rate centered around 3.0% to 3.1%.
- Upside risk is introduced by recent cost-push pressures, including the ISM Prices Index surging to 69.4 in March 2025 and the anticipated inflationary impact of new import tariffs.
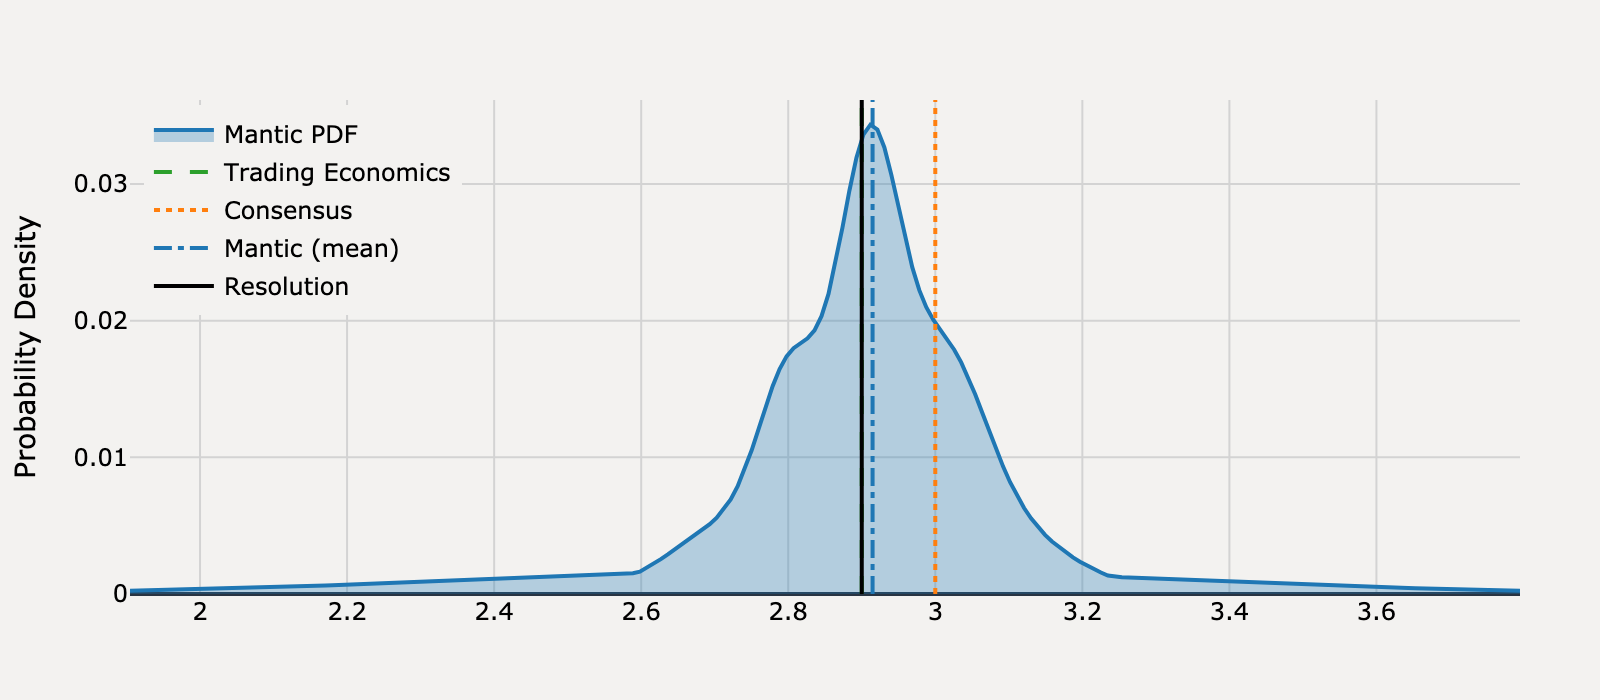
What will United States Core Inflation Rate be for April 2025?
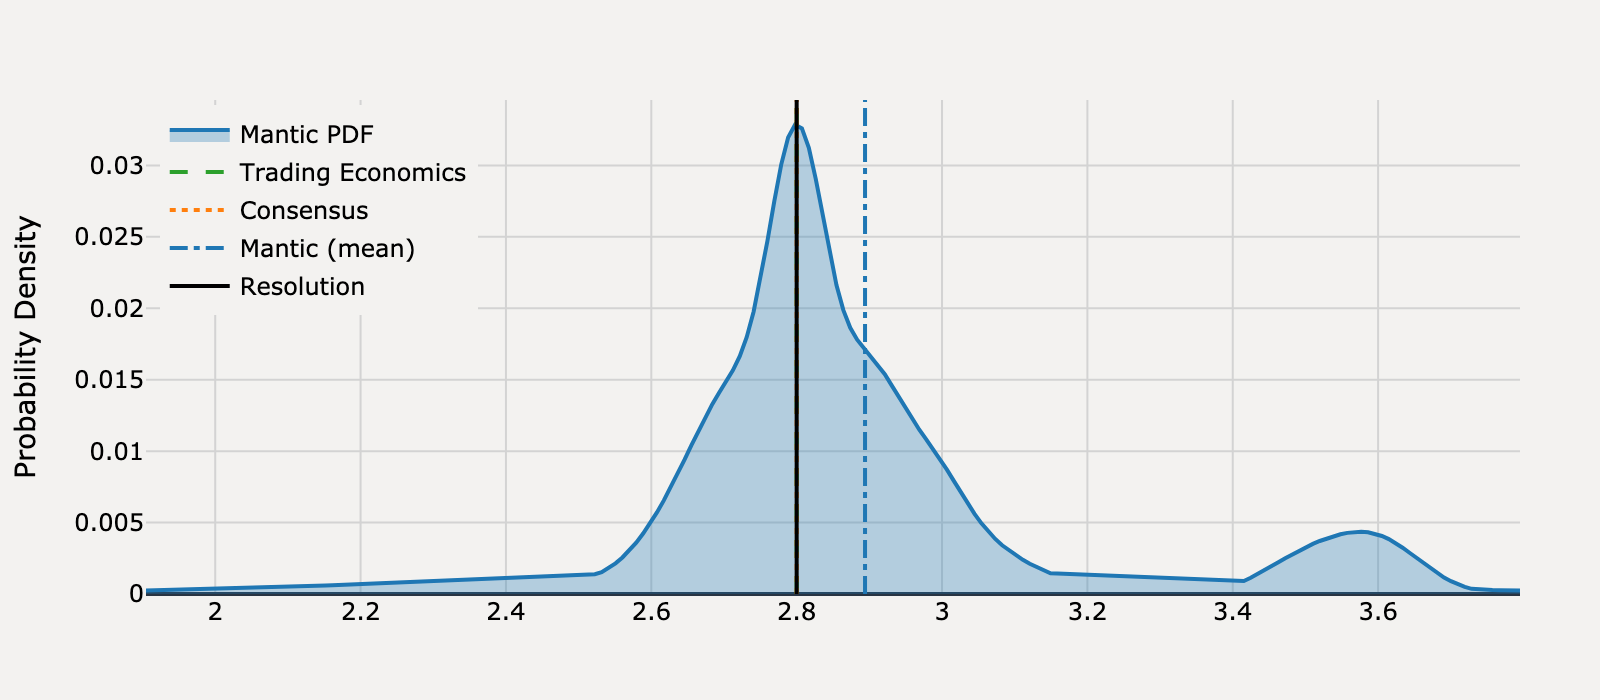
Actual Resolution: 2.80
Best RMSE: Trading Economics, Consensus
Mantic (mean)
2.89
Trading Economics
2.80TIE
Consensus
2.80TIE
RMSE
Mantic (mean)
0.009
Trading Economics
0
Consensus
0
View Mantic Prediction Analysis
- I forecast the United States Core Inflation Rate (year-over-year) for April 2025 to be 2.82%. My 50% confidence interval ranges from 2.74% to 2.96%.
- The forecast is anchored on the 2.8% consensus, which is equivalent to the core inflation rate reported for March 2025.
- Upside risk is substantial due to the surge in the April ISM Services Prices Paid Index to 65.1, signaling building cost pressures in the dominant service sector.
- Maintaining the 2.8% year-over-year rate requires a month-over-month core CPI increase of approximately 0.25% to offset base effects from April 2024.
- Economists warn that the impact of new tariffs on input costs, indicated by the ISM surveys, is expected to accelerate inflation toward 4% by mid-2025, skewing the near-term risk upward.
What will United States Core Inflation Rate be for May 2025?
Actual Resolution: 2.80
Best RMSE: Trading Economics, Consensus
Mantic (mean)
2.92
Trading Economics
2.90TIE
Consensus
2.90TIE
RMSE
Mantic (mean)
0.013
Trading Economics
0.01
Consensus
0.01
View Mantic Prediction Analysis
- I forecast the US Core Inflation Rate (YoY) for May 2025 to be 2.9%, representing a marginal rise from the April rate of 2.8%.
- The increase is mechanically driven by an unfavorable base effect, replacing a soft May 2024 monthly figure with an expected higher May 2025 print.
- The forecast is supported by the consensus market expectation of 2.9% and the Atlanta Federal Reserve's nowcast of a 0.23% monthly Core CPI increase.
- Upside pressure stems from the volatile goods sector, particularly the 4.9% year-over-year surge in used car prices observed in April.
- The sustained disinflation of shelter costs, the largest CPI component, is expected to mitigate these pressures and prevent a sharper acceleration in the core rate.
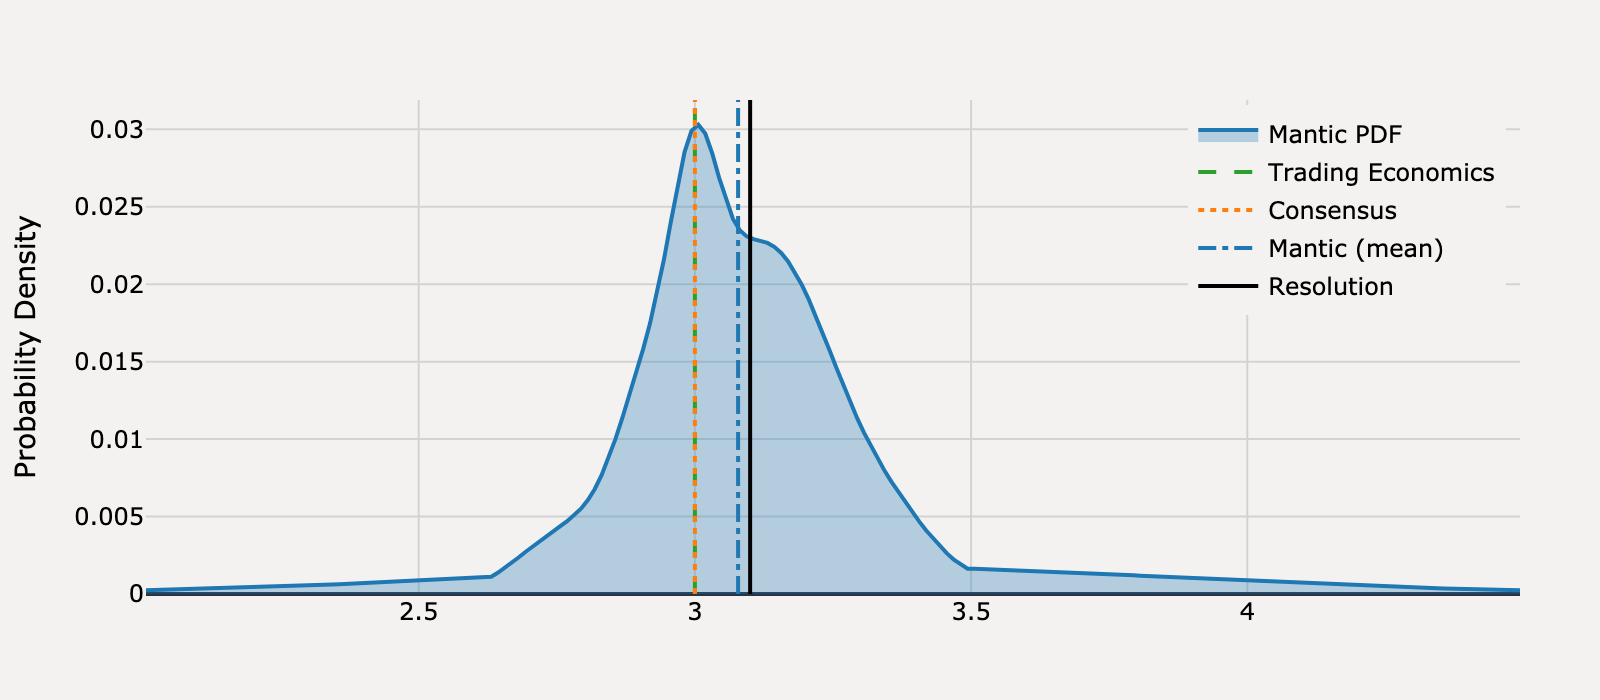
What will United States Core Inflation Rate be for June 2025?
Actual Resolution: 2.90
Best RMSE: Mantic, Trading Economics
Mantic (mean)
2.91TIE
Trading Economics
2.90TIE
Consensus
3.00
RMSE
Mantic (mean)
0
Trading Economics
0
Consensus
0.01
View Mantic Prediction Analysis
- I forecast the United States Core Inflation Rate for June 2025 will be 2.9%. My 50% confidence interval spans 2.81% to 3.01%.
- The latest official Core CPI reading for May 2025 was 2.8%, showing stabilization after a period of deceleration.
- The central prediction of 2.9% is driven by a mechanical "base effect" as the soft monthly core price change from June 2024 is replaced in the year-over-year calculation.
- This calculation aligns with external forecasts, such as the Cleveland Fed nowcast, which anticipates a June monthly core CPI increase in the 0.23% to 0.25% range.
- The upward skew reflects the risk of early price pass-through from recently imposed tariffs, compounding pressure from sticky core services inflation.
What will United States Core Inflation Rate be for July 2025?
Actual Resolution: 3.10
Best RMSE: Mantic
Mantic (mean)
3.08BEST
Trading Economics
3.00
Consensus
3.00
RMSE
Mantic (mean)
0
Trading Economics
0.01
Consensus
0.01
View Mantic Prediction Analysis
- I estimate the US Core Inflation Rate (Core CPI YoY) for July 2025 will be 3.07%, with an 80% confidence interval spanning 2.81% to 3.45%.
- The upward trend is supported by a mechanical base effect, where the unusually low month-over-month Core CPI print from July 2024 structurally favors a higher year-over-year rate in July 2025.
- New inflationary pressure is evident in core goods prices, with reports of businesses accelerating the pass-through of tariff-related costs for categories such as household furnishings and appliances (MSN).
- Analysts forecast month-over-month Core CPI increases of 0.3% to 0.4% for July, a rate which translates mathematically to a year-over-year rate above the 3.0% consensus.
- A cooling labor market, evidenced by July unemployment rising to 4.2% alongside weak job creation, provides a key disinflationary counter-pressure that tempers the overall services price trend.
What will United States Core Inflation Rate be for August 2025?
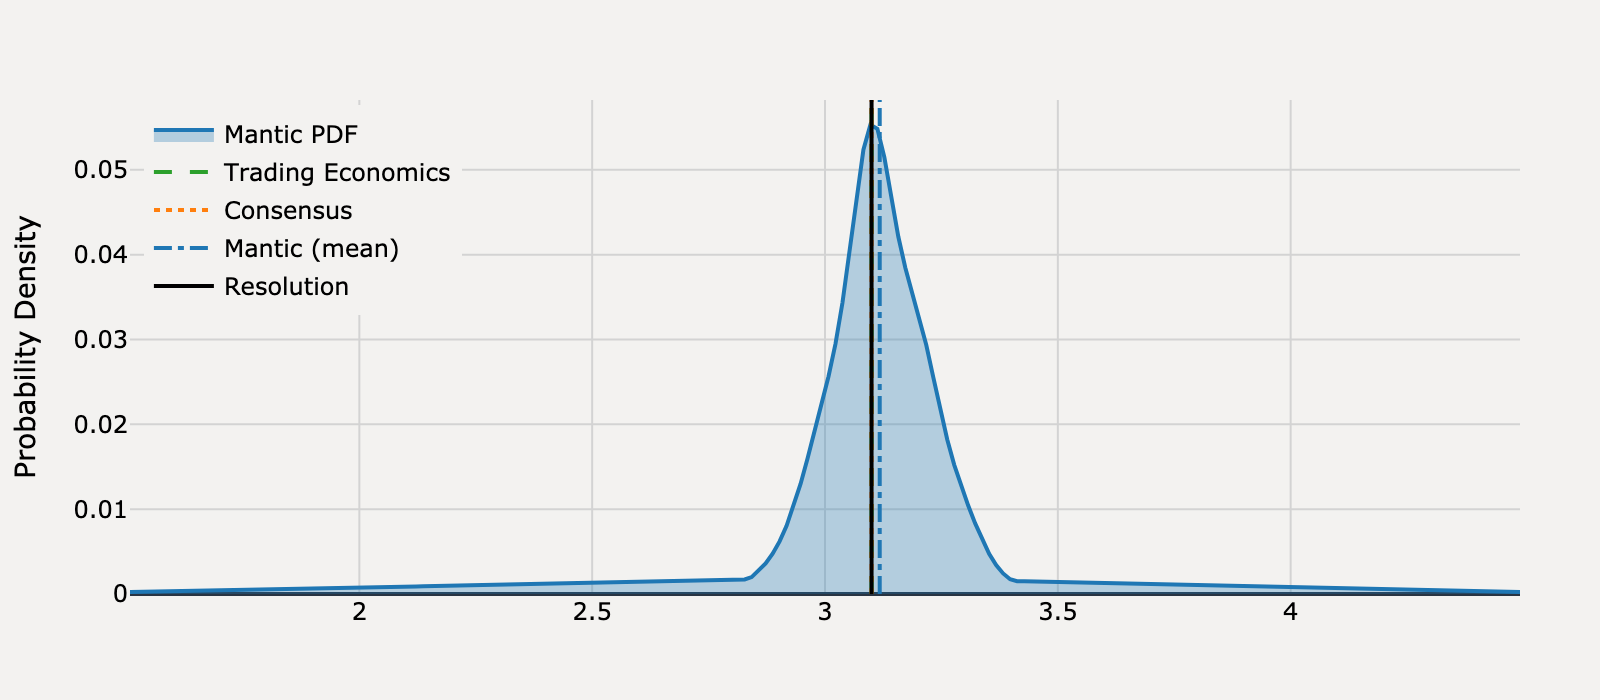
Actual Resolution: 3.10
Best RMSE: Mantic, Trading Economics, Consensus
Mantic (mean)
3.12TIE
Trading Economics
3.10TIE
Consensus
3.10TIE
RMSE
Mantic (mean)
0
Trading Economics
0
Consensus
0
View Mantic Prediction Analysis
- I forecast the US Core Inflation Rate (YoY) for August 2025 to be 3.1%; the 80% confidence interval spans 2.77% to 3.33%.
- This forecast is anchored on the July 2025 Core CPI reading of 3.1% and aligns with the external consensus projection and the Cleveland Fed's Nowcast for August.
- Inflationary pressure on core goods is evident, stemming from new 2025 tariffs that are causing cost-pass-through to consumers and an accompanying surge in the July Core Producer Price Index.
- The rate is being kept sticky by persistent inflation in core services, which is still running above levels consistent with the Federal Reserve’s 2% target.
- The primary restraint on inflation comes from slowing economic growth and the market expectation of a near-term Federal Reserve interest rate cut, which dampens overall demand.
What will United States Core Inflation Rate be for September 2025?
Actual Resolution: 3.00
Best RMSE: Trading Economics
Mantic (mean)
3.02
Trading Economics
3.00BEST
Consensus
3.10
RMSE
Mantic (mean)
0.001
Trading Economics
0
Consensus
0.01
View Mantic Prediction Analysis
- I forecast the United States Core Inflation Rate (YoY CPI) for September 2025 will be 3.0% (median estimate 3.03%). The 80% confidence interval is 2.84% to 3.52%.
- The Cleveland Fed's Inflation Nowcasting model strongly anchors the forecast, estimating the September rate at 2.96%.
- The predicted deceleration from 3.1% in August 2025 is supported by a favorable base effect; the September 2024 rate was a higher 3.3%.
- Upside risks persist from the services sector and tariffs on imported goods. The September ISM Services Prices Index was 69.4, indicating sticky price increases.
- The consensus forecast anticipates the rate will remain flat at 3.1%, showing a conflict between market expectations and high-frequency nowcasting models.
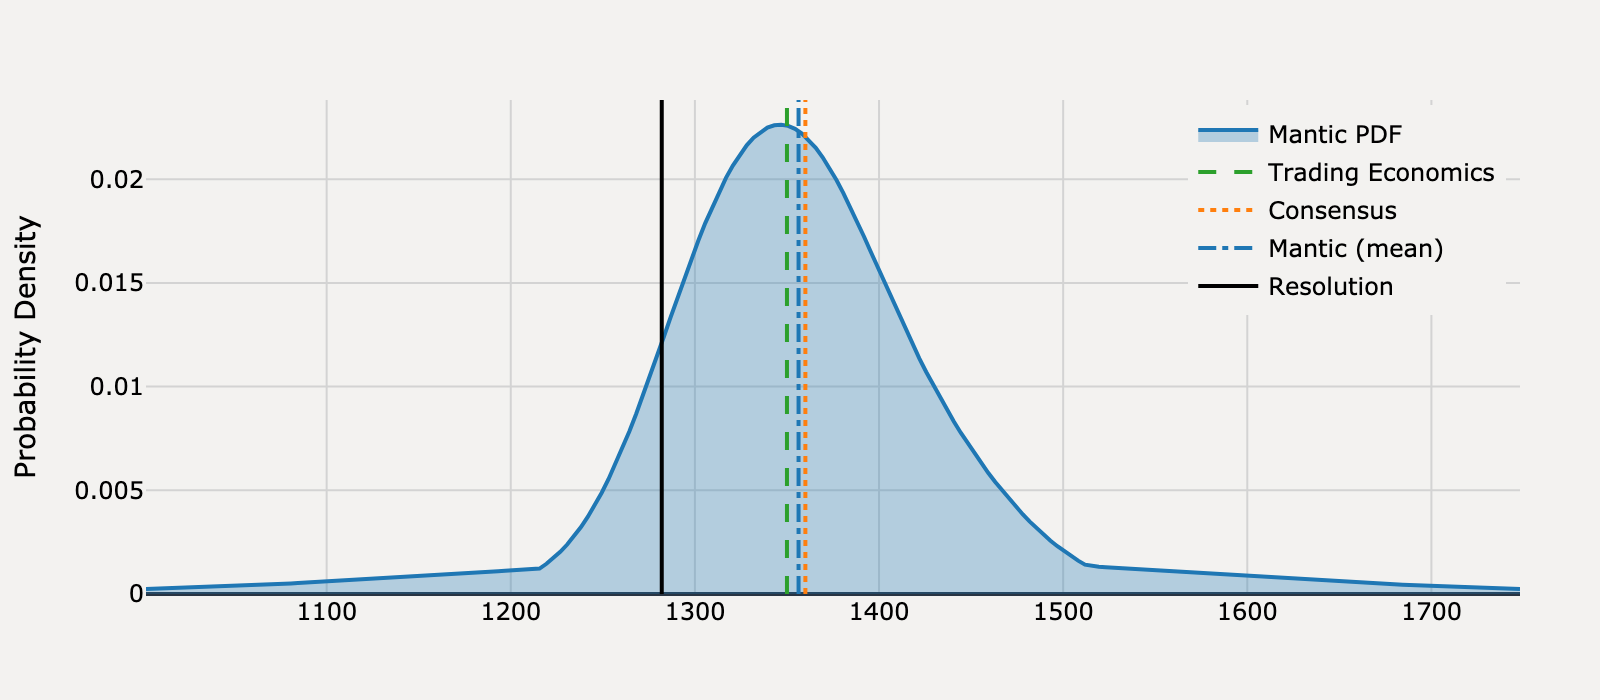
What will United States Housing Starts be for January 2025?
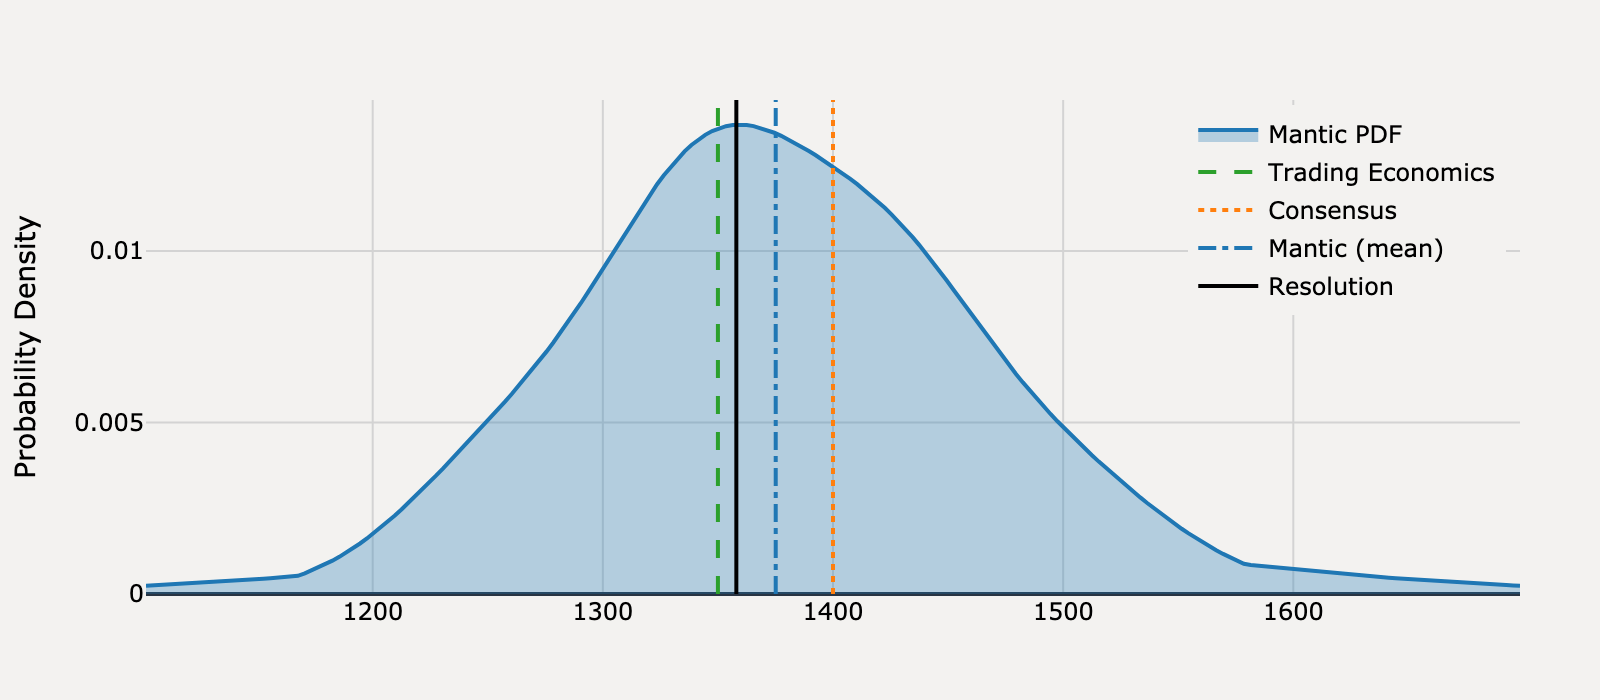
Actual Resolution: 1,358
Best RMSE: Trading Economics
Mantic (mean)
1,375
Trading Economics
1,350BEST
Consensus
1,400
RMSE
Mantic (mean)
292.8
Trading Economics
64.00
Consensus
1,764
View Mantic Prediction Analysis
- I forecast US Housing Starts for January 2025 at a median of 1,370 thousand units, with an 80% confidence interval spanning 1,250 to 1,510 thousand units.
- This represents a sharp expected decline from the December 2024 reading of 1,499 thousand units, which was inflated by a volatile 58.9% surge in multi-family starts.
- The primary mechanical constraint was the reported "frigid weather" in January, the coldest since 2011, which significantly curtailed weather-sensitive ground-breaking activity.
- Financial data from major homebuilders (DHI, LEN) showed year-over-year revenue deceleration in late 2024, signaling a sector-wide cooling that promotes cautious new project starts.
- Elevated mortgage rates near 7% in mid-January and high new home inventory (494 thousand units in December) further limited the incentive for new construction starts.
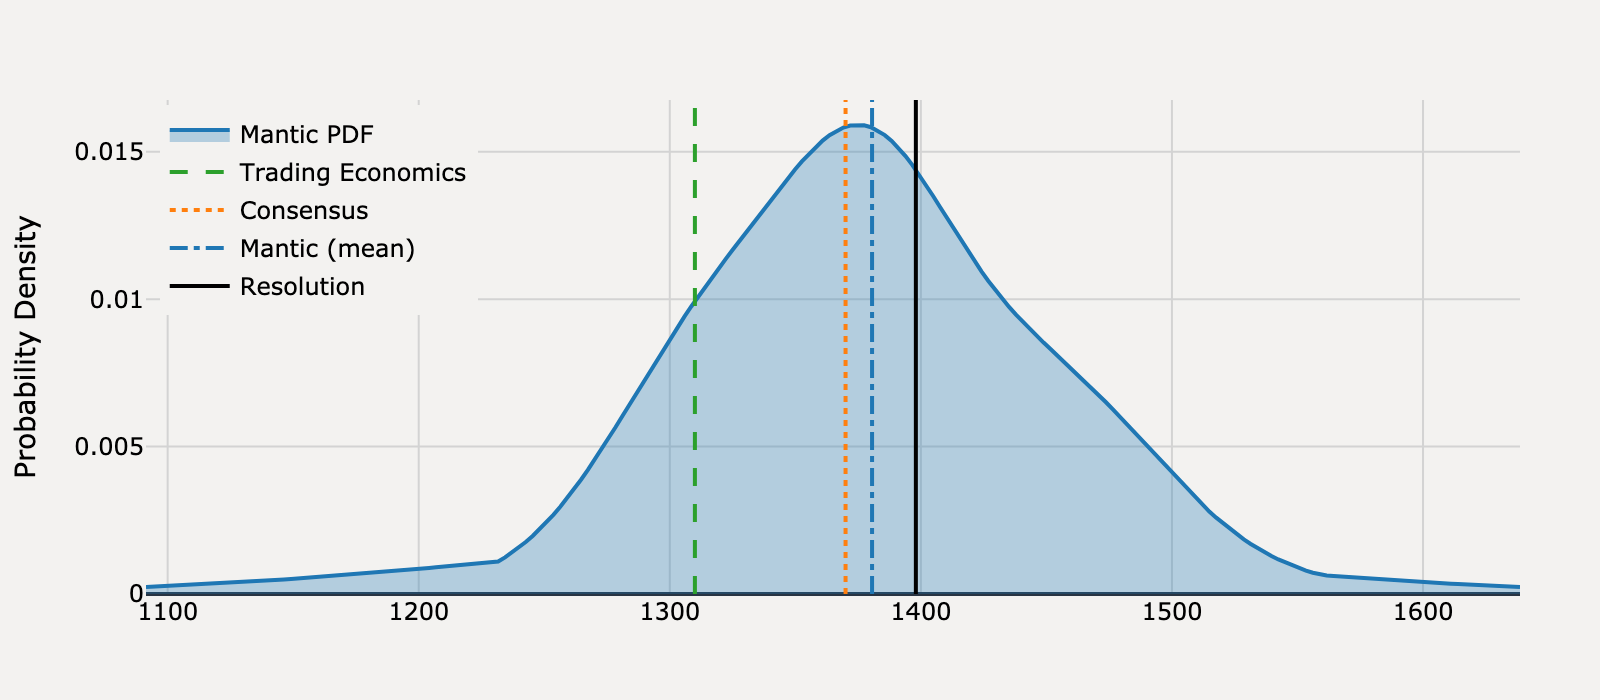
What will United States Housing Starts be for February 2025?

Actual Resolution: 1,490
Best RMSE: Consensus
Mantic (mean)
1,377
Trading Economics
1,340
Consensus
1,380BEST
RMSE
Mantic (mean)
12,746
Trading Economics
22,500
Consensus
12,100
View Mantic Prediction Analysis
- I forecast United States Housing Starts for February 2025 will be 1,370 thousand units, with a 50% confidence interval of 1,320 to 1,430 thousand units.
- The forecast is statistically flat compared to the 1,366 thousand units reported in January 2025, which reflects a balance of opposing forces.
- The expected technical rebound from January's severe weather disruptions is offset by sharply deteriorated builder sentiment.
- The NAHB Housing Market Index for February 2025 fell to 42, the lowest level in five months, indicating widespread caution among builders.
- Uncertainty over material costs and supply, driven by threats of increased tariffs on softwood lumber and gypsum, further depresses the motivation for new groundbreakings.
What will United States Housing Starts be for March 2025?
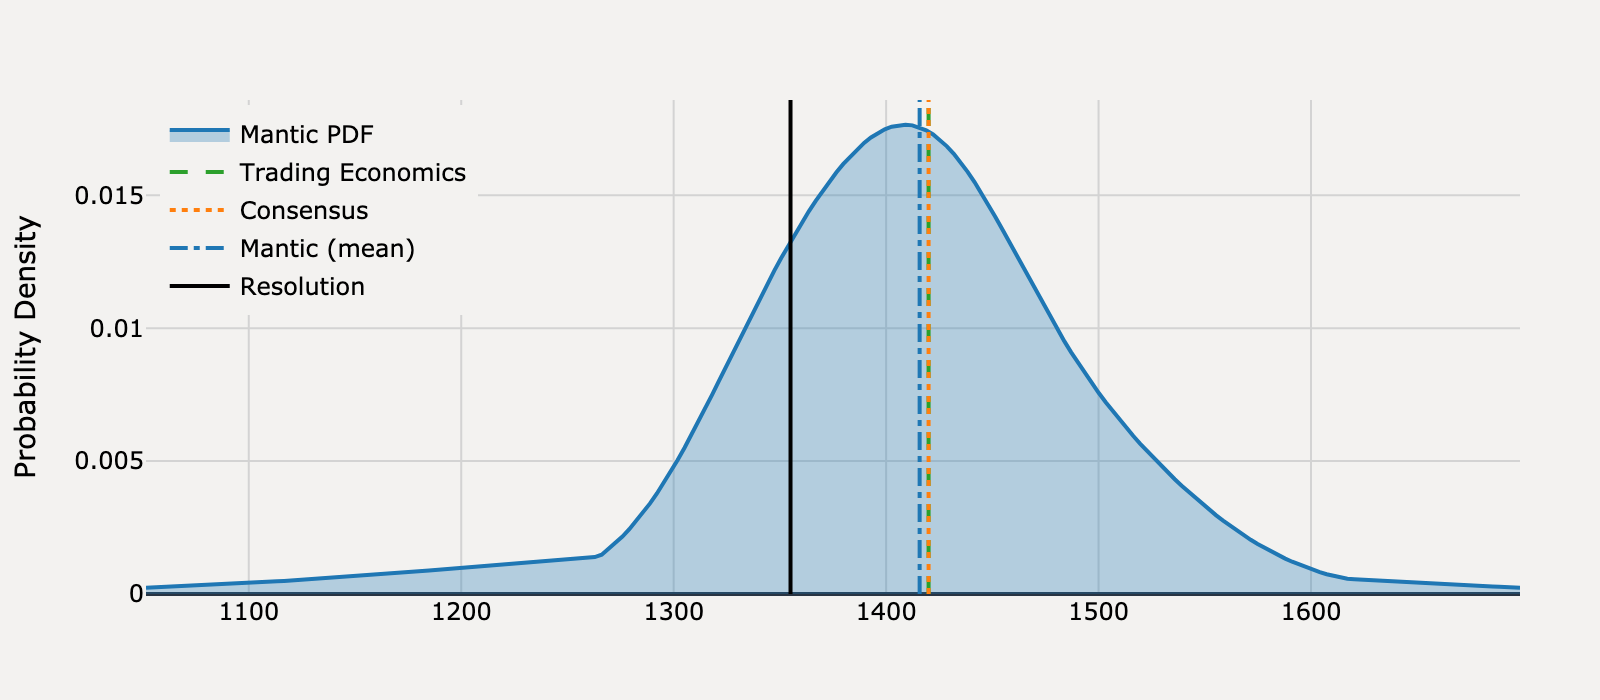
Actual Resolution: 1,355
Best RMSE: Mantic
Mantic (mean)
1,416BEST
Trading Economics
1,420
Consensus
1,420
RMSE
Mantic (mean)
3,695
Trading Economics
4,225
Consensus
4,225
View Mantic Prediction Analysis
- I forecast United States Housing Starts for March 2025 to be 1,410 thousand units, with a 50% confidence interval spanning 1,360 to 1,460 thousand units.
- The forecast anticipates a mechanical correction from the February 2025 rate of 1,501 thousand units, which was largely seen as a rebound compensating for January’s weather-related low of 1,350 thousand units.
- February Building Permits, a key leading indicator, were reported at 1,456 thousand units, a level that structurally supports a lower March starts figure than the one recorded in February.
- Homebuilder sentiment plunged to a seven-month low in March, reflecting concerns over persistently high mortgage rates near 7% and a growing inventory of unsold new homes, which will limit the initiation of new projects.
What will United States Housing Starts be for April 2025?
Actual Resolution: 1,398
Best RMSE: Mantic
Mantic (mean)
1,381BEST
Trading Economics
1,310
Consensus
1,370
RMSE
Mantic (mean)
304.2
Trading Economics
7,744
Consensus
784.0
View Mantic Prediction Analysis
- I forecast US Housing Starts for April 2025 to be 1,380 thousand units, an upward correction from the sharp decline to 1,324 thousand units reported in March.
- March 2025 Building Permits stood at 1,467 thousand units, creating a 143-thousand-unit gap with Starts. This divergence suggests an accumulated backlog of permitted projects that will drive an increase in starts in April.
- The forecast is supported by qualitative guidance from major homebuilders like D.R. Horton, who expect starts to accelerate in the April-June quarter due to a recent pickup in sales activity.
- Sustained high 30-year fixed mortgage rates, measured at 6.76% in early May, and concerns over material cost inflation limit the recovery and keep the forecast near the 12-month average of 1,364 thousand units.
What will United States Housing Starts be for May 2025?
Actual Resolution: 1,282
Best RMSE: Trading Economics
Mantic (mean)
1,356
Trading Economics
1,350BEST
Consensus
1,360
RMSE
Mantic (mean)
5,520
Trading Economics
4,624
Consensus
6,084
View Mantic Prediction Analysis
- I estimate United States Housing Starts for May 2025 will be 1,350 thousand units (Seasonally Adjusted Annual Rate). My 50% confidence interval spans 1,310 thousand to 1,400 thousand units.
- The forecast is anchored to the April 2025 reading of 1,361 thousand units, which aligns closely with the 12-month average of 1,368 thousand units.
- The forecast carries a slight downside skew due to deteriorating leading indicators, including the 4.7% decline in April Building Permits to 1,412 thousand units.
- The NAHB Housing Market Index fell sharply to 34 in May, confirming a substantial drop in homebuilder confidence driven by suppressed demand.
- High mortgage rates, which averaged near 7.0% in May, maintain affordability constraints that continue to weigh heavily on the single-family segment of the market.
What will United States Housing Starts be for June 2025?
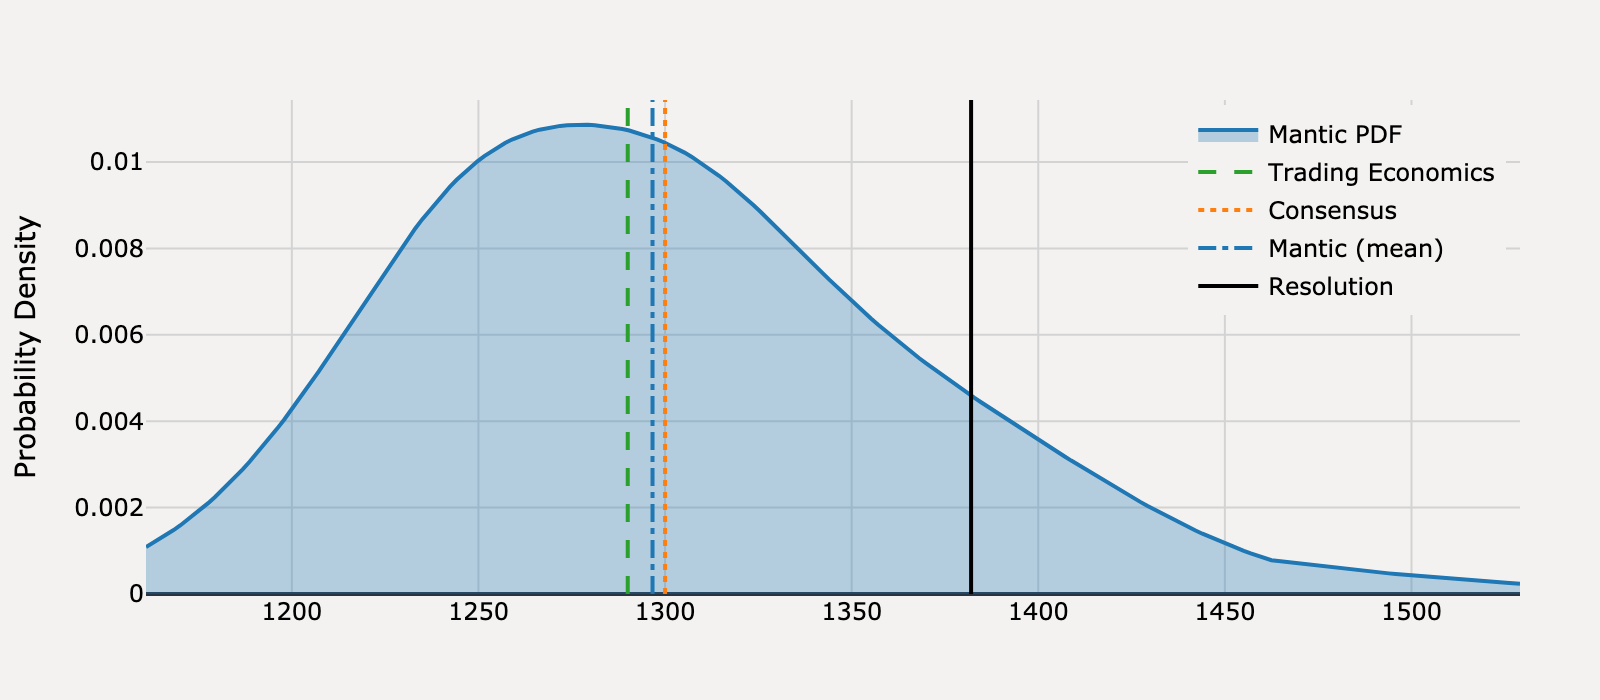
Actual Resolution: 1,382
Best RMSE: Consensus
Mantic (mean)
1,297
Trading Economics
1,290
Consensus
1,300BEST
RMSE
Mantic (mean)
7,286
Trading Economics
8,464
Consensus
6,724
View Mantic Prediction Analysis
- I forecast that United States Housing Starts for June 2025 will be 1,290 thousand units, representing a modest rebound from the 1,256 thousand units reported in May 2025.
- The May figure was significantly suppressed by a nearly 30% collapse in the volatile multifamily construction segment.
- The forecast is constrained by extremely poor builder confidence; the NAHB/Wells Fargo Housing Market Index fell further to 32 in June 2025 due to high mortgage rates and elevated inventory.
- Building permits, a leading indicator, limit a sharper decline, with preliminary June 2025 forecasts placing them near 1,390 thousand units.
- The resulting gap between starts and permits suggests a substantial backlog of authorized projects that supports a floor under new construction activity.
What will United States Housing Starts be for July 2025?
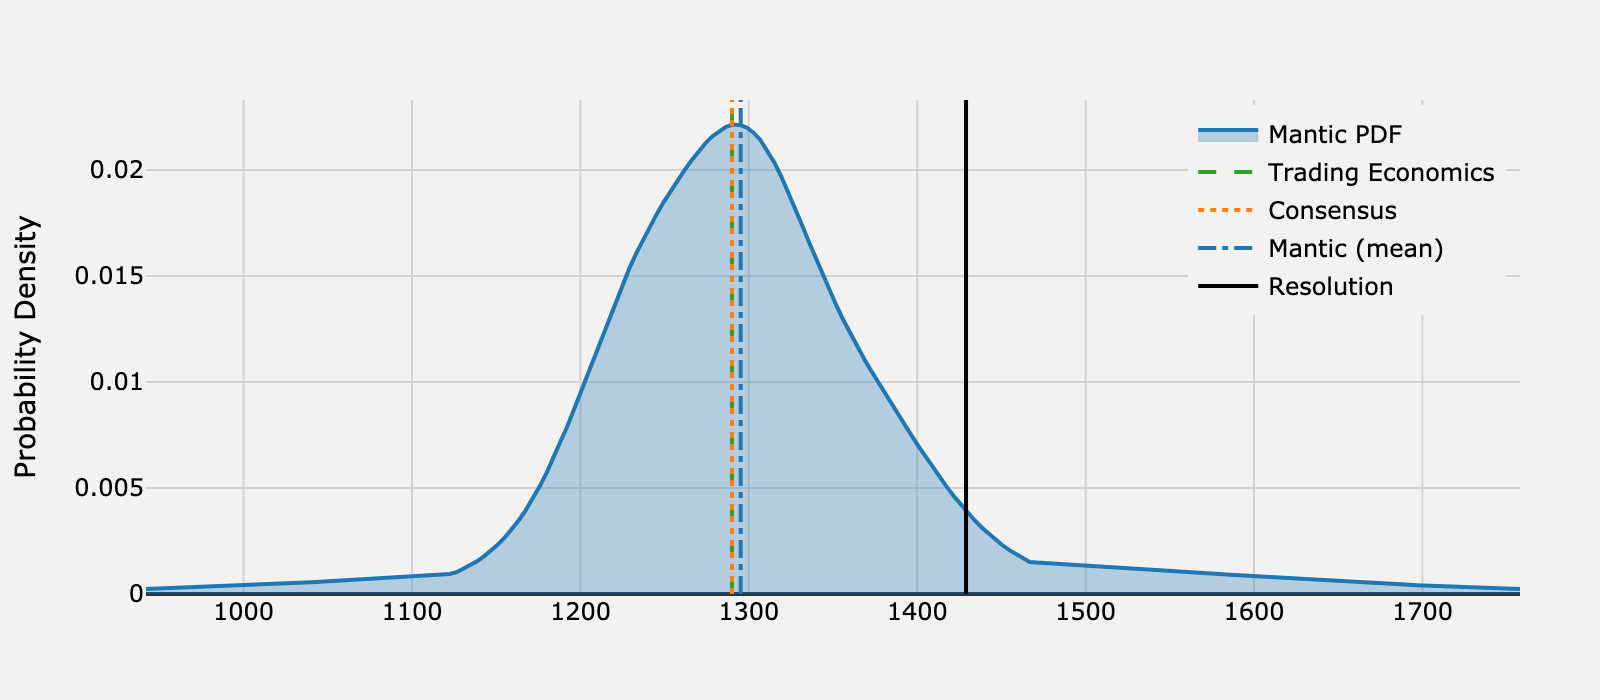
Actual Resolution: 1,429
Best RMSE: Mantic
Mantic (mean)
1,295BEST
Trading Economics
1,290
Consensus
1,290
RMSE
Mantic (mean)
17,905
Trading Economics
19,321
Consensus
19,321
View Mantic Prediction Analysis
- I forecast United States Housing Starts for July 2025 will be 1,290 thousand units. The 50% confidence interval ranges from 1,240 to 1,350 thousand units.
- This median forecast aligns with the market consensus and implies a slight deceleration from the June value of 1,321 thousand units (Source: U.S. Census Bureau/FRED HOUST).
- The predicted monthly decline stems from the expectation that the volatile 30.6% surge in multi-family starts seen in June will moderate in July.
- Single-family construction remains fundamentally constrained by high mortgage rates (30-year fixed rate averaged 6.63% in early August) and affordability challenges.
- This structural weakness is supported by homebuilder data, with D.R. Horton reporting a 16% year-over-year decrease in its sales order backlog as of June 30, 2025.
What will United States Housing Starts be for August 2025?
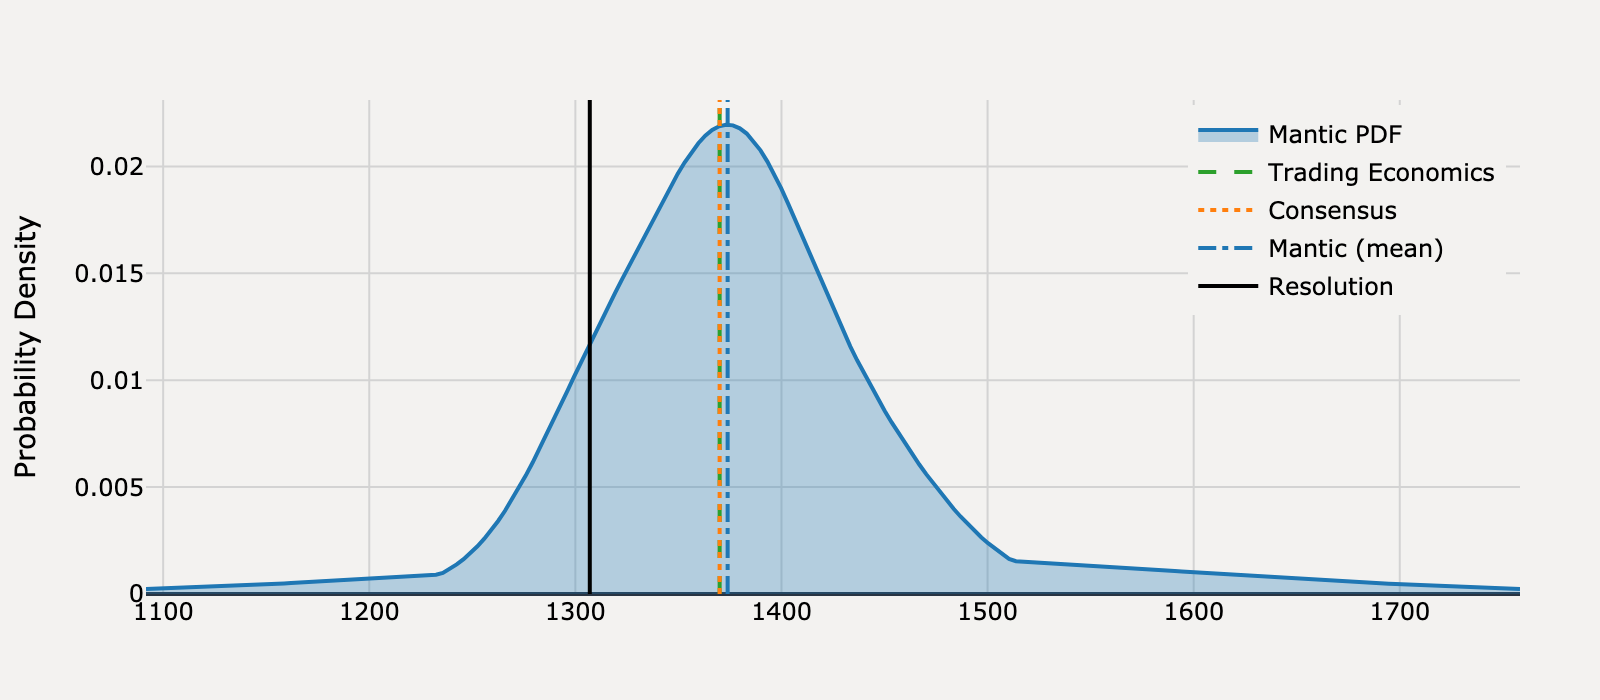
Actual Resolution: 1,307
Best RMSE: Trading Economics, Consensus
Mantic (mean)
1,374
Trading Economics
1,370TIE
Consensus
1,370TIE
RMSE
Mantic (mean)
4,473
Trading Economics
3,969
Consensus
3,969
View Mantic Prediction Analysis
- I forecast U.S. Housing Starts for August 2025 at a median of 1,380 thousand units (SAAR), with a 50% confidence interval of 1,330 to 1,420 thousand units.
- The forecast anticipates a mechanical reversion from the high July 2025 figure of 1,428 thousand units toward recent average activity.
- This anticipated correction is based on July 2025 Building Permits, a key leading indicator, which fell significantly to 1,362 thousand units.
- New construction activity remains fundamentally constrained by high financing costs, with the 30-year fixed mortgage rate at 6.50% in early September 2025.
- The low builder confidence, reflected by the NAHB Index of 32 in August, suggests homebuilders will continue to exercise caution regarding new project starts.
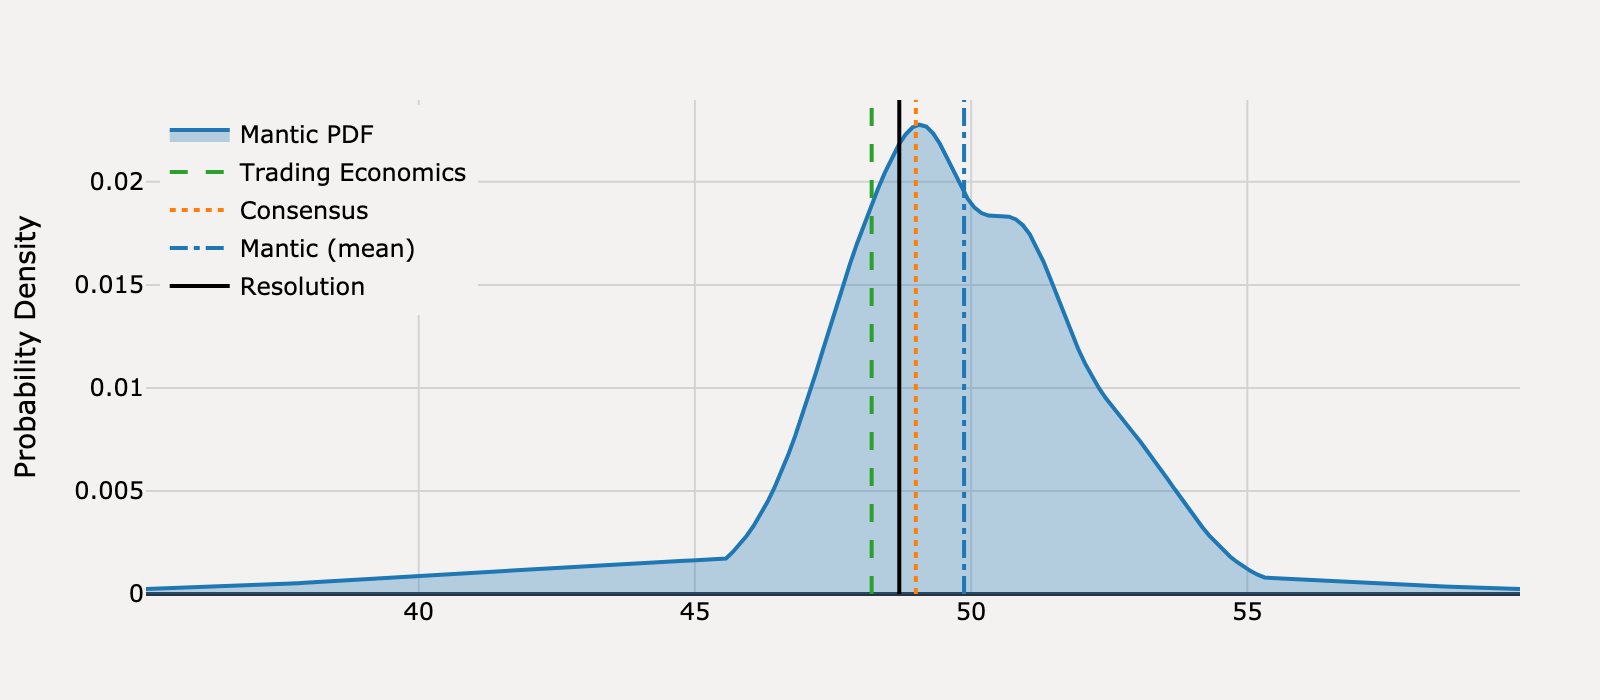
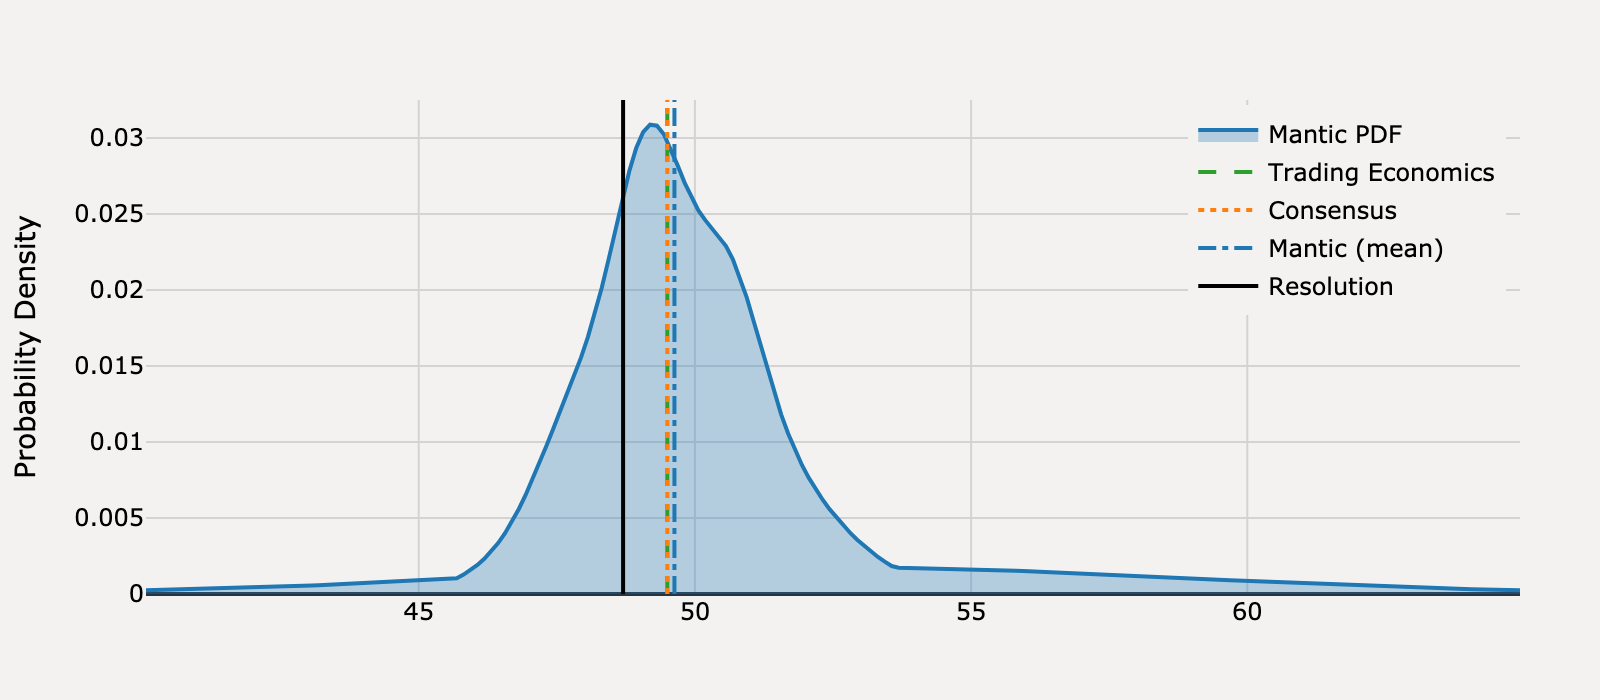
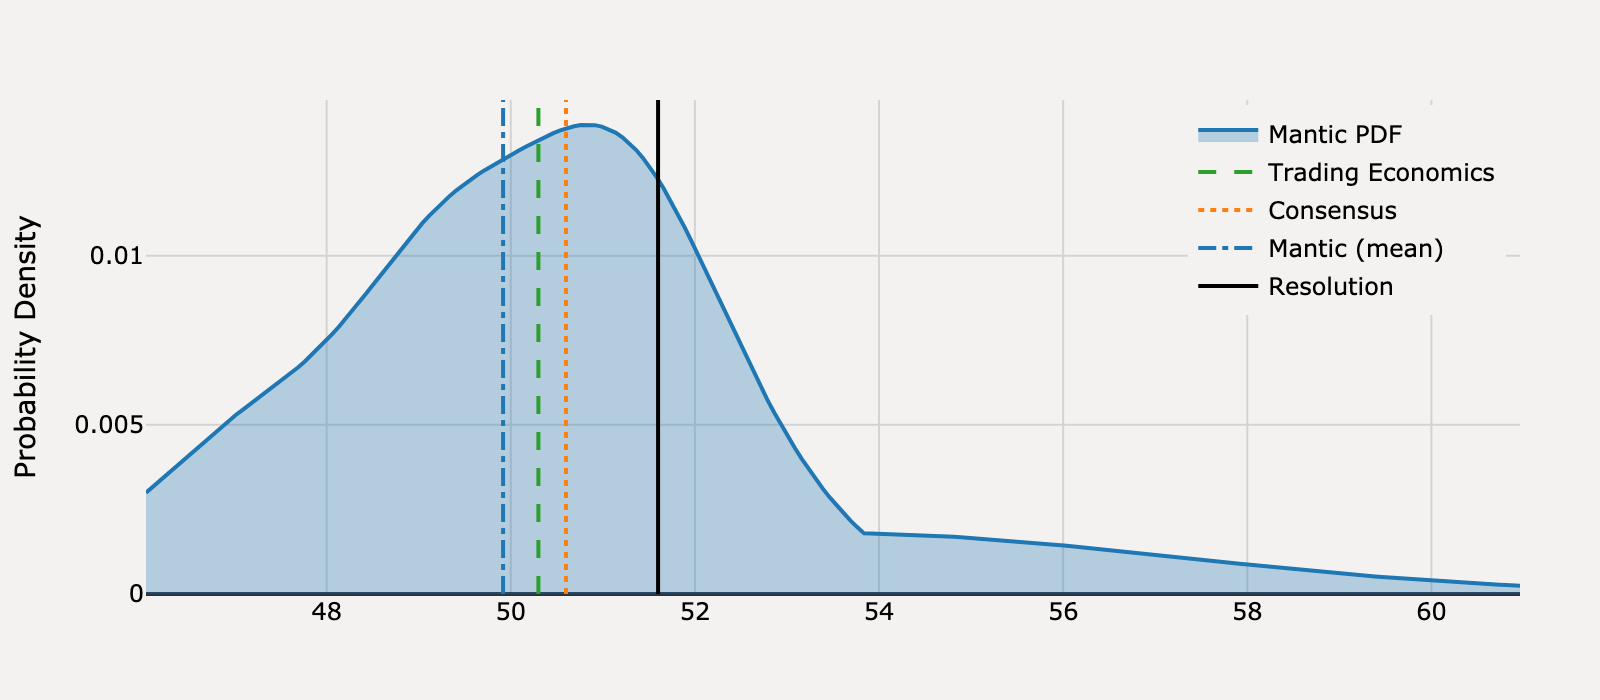
What will United States ISM Manufacturing PMI be for January 2025?
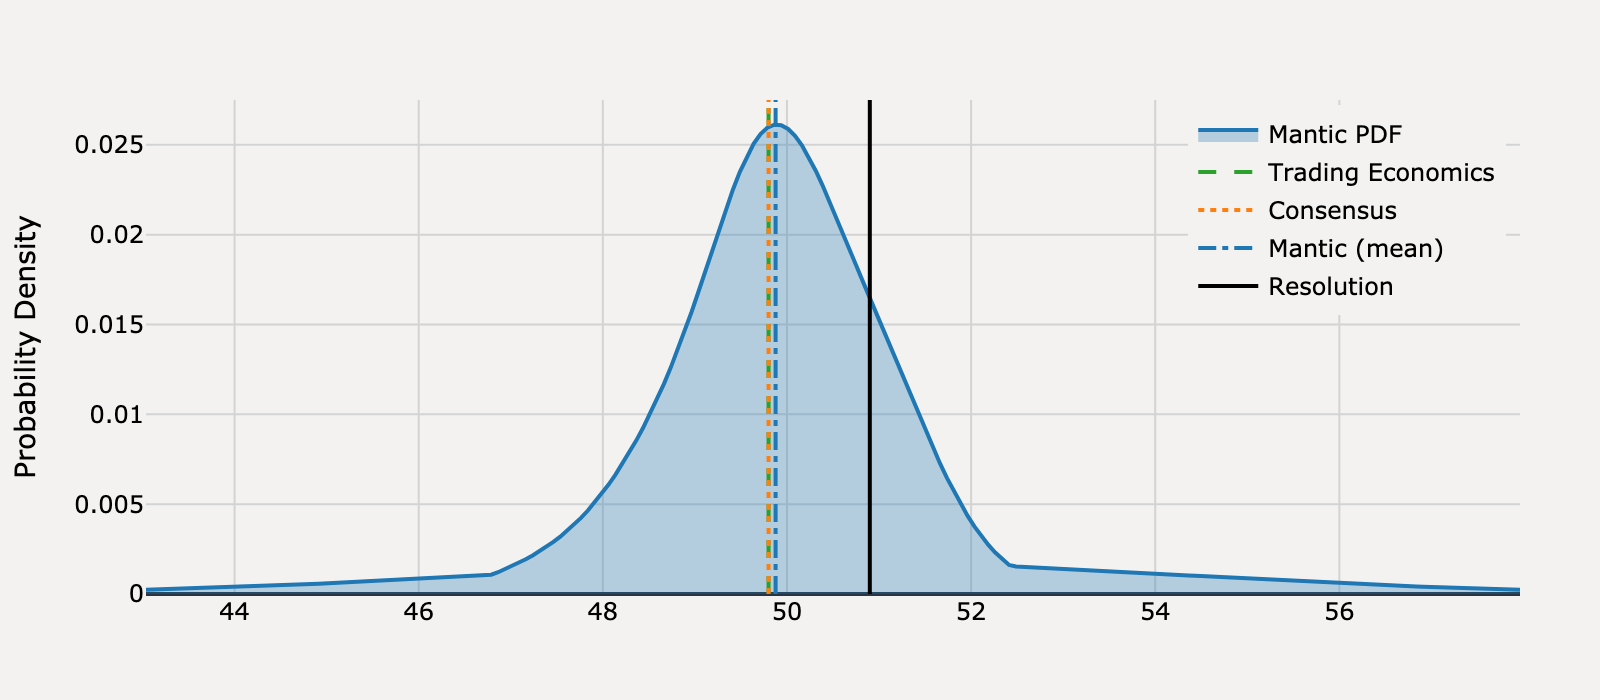
Actual Resolution: 50.90
Best RMSE: Mantic
Mantic (mean)
49.88BEST
Trading Economics
49.80
Consensus
49.80
RMSE
Mantic (mean)
1.05
Trading Economics
1.21
Consensus
1.21
View Mantic Prediction Analysis
- I forecast the US ISM Manufacturing PMI for January 2025 will be 50.0 points.
- The 50% confidence interval for the PMI ranges from 49.1 to 50.8 points.
- The PMI for December 2024 was 49.3, which continued the trend of contraction but at a slower rate than the previous month (48.4).
- Two crucial December subindexes, New Orders (52.5) and Production (50.3), crossed into expansion territory, signaling stabilizing demand and output.
- A key headwind is the ISM Employment Index, which remained in significant contraction in December at 45.3 points.
What will United States ISM Manufacturing PMI be for February 2025?
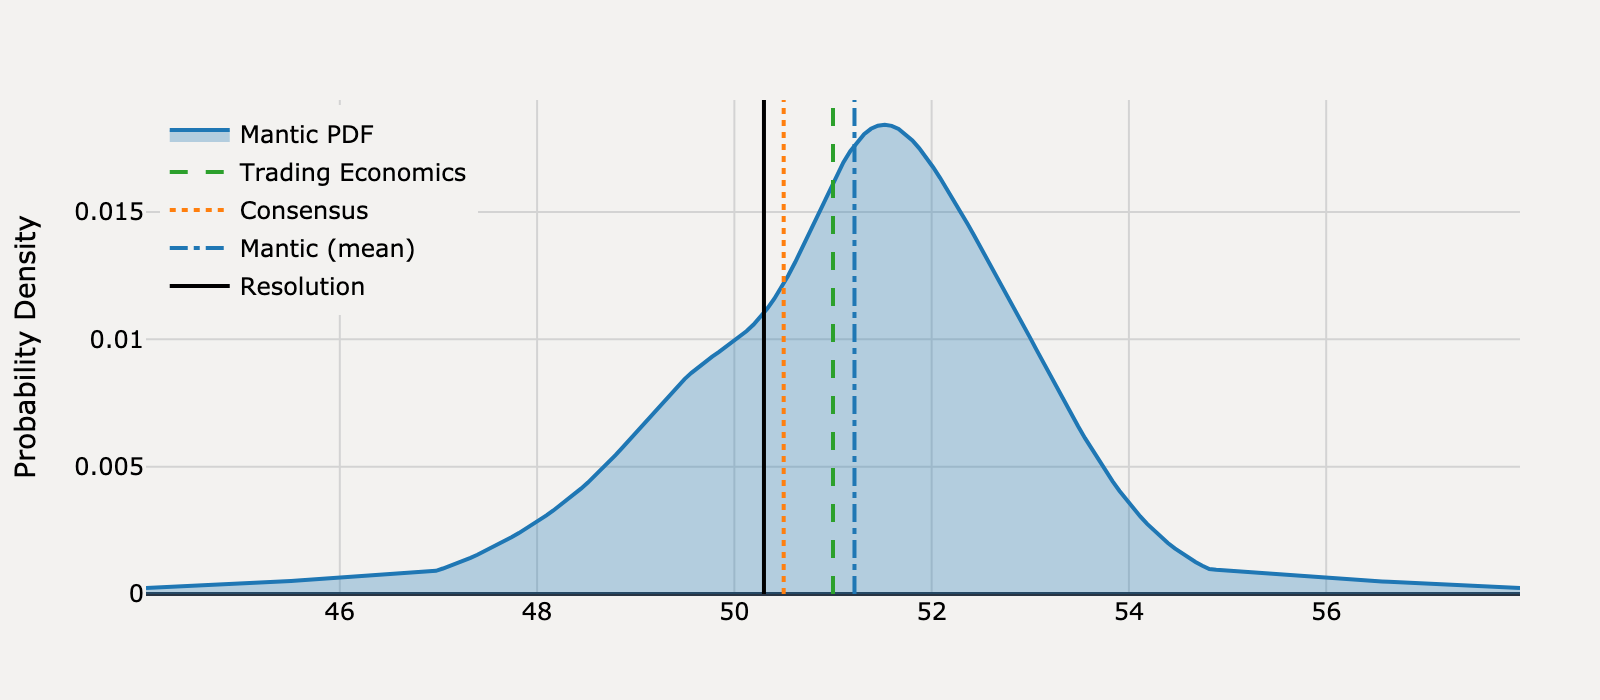
Actual Resolution: 50.30
Best RMSE: Consensus
Mantic (mean)
51.22
Trading Economics
51.00
Consensus
50.50BEST
RMSE
Mantic (mean)
0.842
Trading Economics
0.49
Consensus
0.04
View Mantic Prediction Analysis
- I forecast the United States ISM Manufacturing PMI for February 2025 will be 51.5 points, with a 50% confidence interval spanning from 50.0 to 52.5 points.
- The forecast for continued modest expansion is anchored on the S&P Global flash US Manufacturing PMI for February, which increased to 51.6.
- This activity is likely driven by manufacturers "front-running" potential cost increases from anticipated tariffs on steel and aluminum scheduled for March.
- The January ISM reading of 50.9 ended a 26-month period of manufacturing contraction, establishing the current trend of modest growth.
- The sustainability of this expansion is questionable, given that bellwethers like Caterpillar project lower sales volumes and unfavorable price realization for the full year 2025.
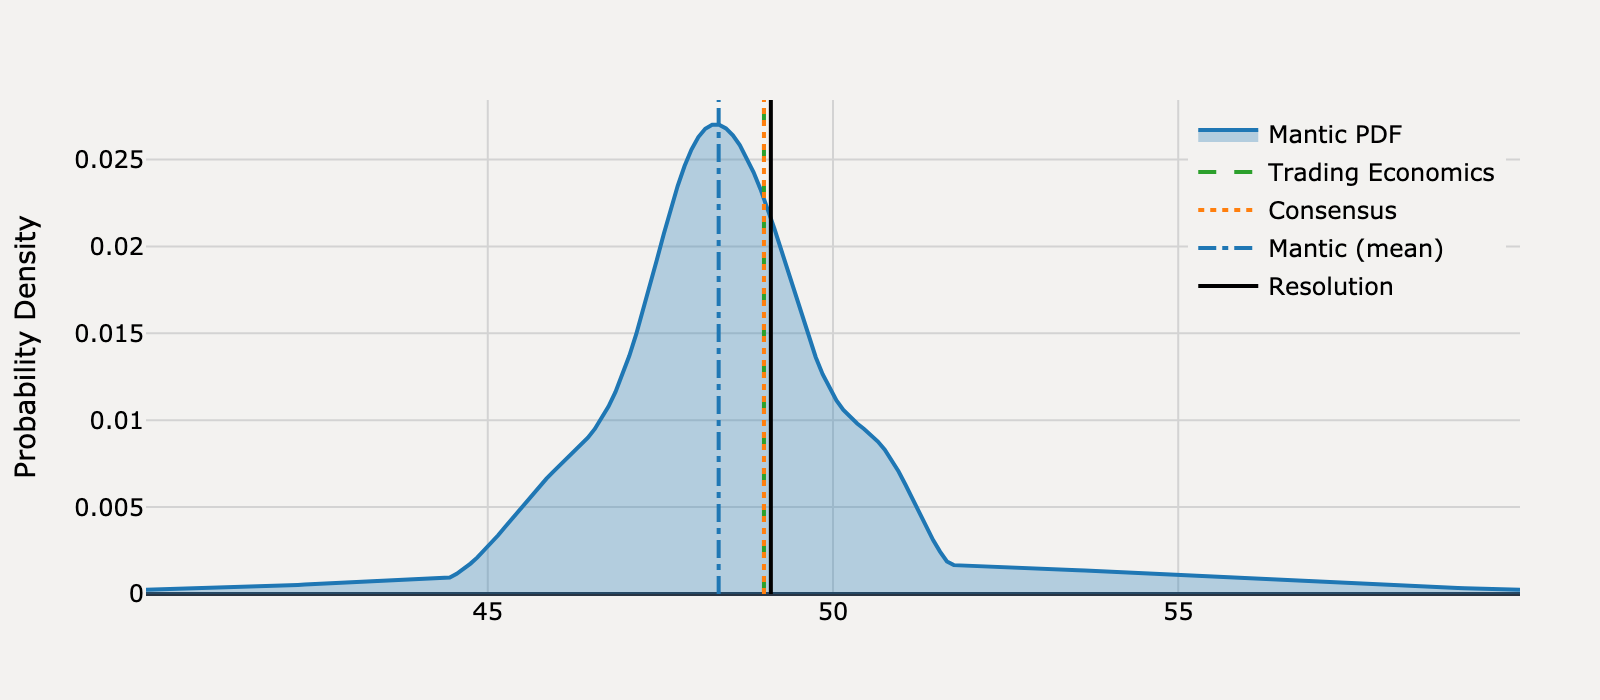
What will United States ISM Manufacturing PMI be for March 2025?
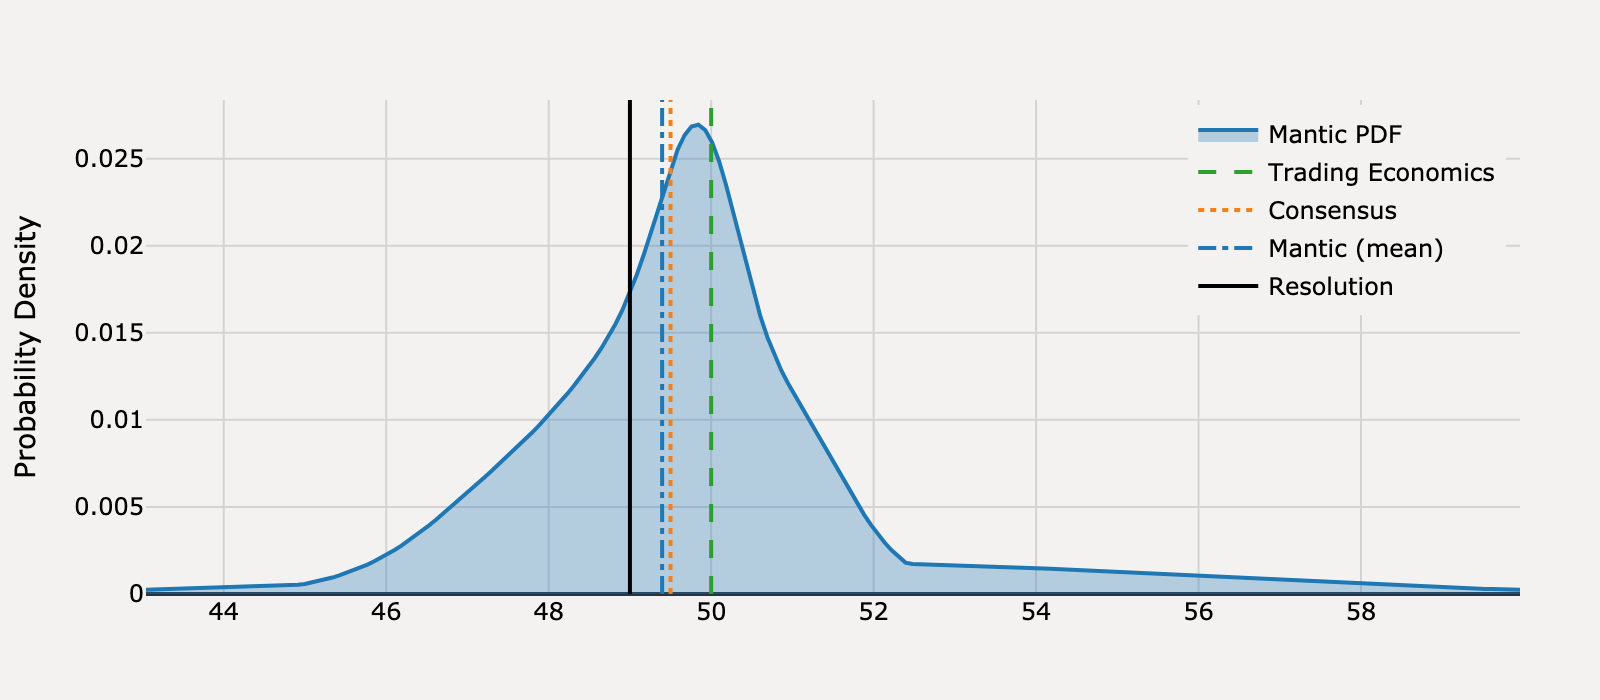
Actual Resolution: 49.00
Best RMSE: Mantic
Mantic (mean)
49.40BEST
Trading Economics
50.00
Consensus
49.50
RMSE
Mantic (mean)
0.157
Trading Economics
1.00
Consensus
0.25
View Mantic Prediction Analysis
- I forecast the US ISM Manufacturing PMI for March 2025 will be 49.7, indicating a slight contraction compared to the 50.3 recorded in February. The 50% confidence interval is 48.5 to 50.7.
- Business sentiment has deteriorated significantly, driven by uncertainty over new and threatened tariffs on goods from Mexico, Canada, and China.
- Demand signals are weak; the S&P Global flash Manufacturing PMI for March 2025 fell sharply to 49.8, and the ISM New Orders index was already contracting at 48.6 in February.
- The overall ISM index is technically supported near the neutral 50-mark by the Supplier Deliveries index (54.5 in February), which is artificially elevated as firms rush to front-load materials ahead of tariff deadlines.
- Major industrial bellwethers reflect this slowdown, with firms like Deere reporting sharp year-over-year revenue declines and recent negative earnings surprises.
What will United States ISM Manufacturing PMI be for April 2025?
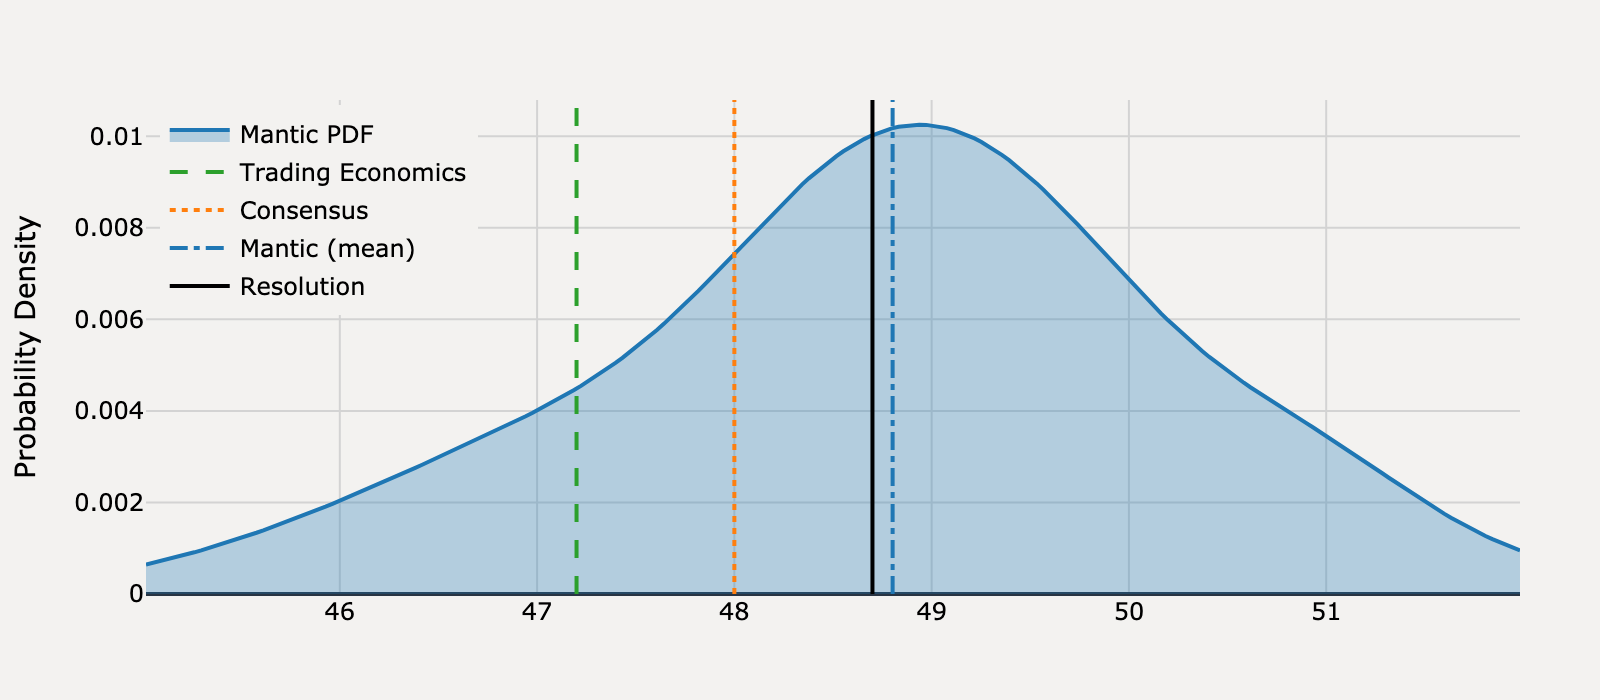
Actual Resolution: 48.70
Best RMSE: Mantic
Mantic (mean)
48.80BEST
Trading Economics
47.20
Consensus
48.00
RMSE
Mantic (mean)
0.01
Trading Economics
2.25
Consensus
0.49
View Mantic Prediction Analysis
- The median forecast for the United States ISM Manufacturing PMI for April 2025 is 48.8 points, a slight deterioration from the 49.0 points recorded in March.
- Regional data signals a sharp collapse in business sentiment in April following the announcement of new tariffs. The Philadelphia Fed Manufacturing Index plummeted to -26, the lowest reading since April 2023.
- The underlying demand picture remains weak, which exerts downward pressure on the headline index. The crucial forward-looking New Orders sub-index was already deeply contractionary at 45.2 in March.
- The forecasted decline is moderated by the mechanical components of the PMI. Tariff uncertainty is driving companies to stockpile inventory and accept slower deliveries, which artificially boosts the overall index.
- The conflicting S&P Global Flash Manufacturing PMI printed 50.7 in April, but a potential surge in reported input costs (7.0 point increase to 69.4 in March) suggests price inflation is outpacing actual activity.
What will United States ISM Manufacturing PMI be for May 2025?

Actual Resolution: 48.50
Best RMSE: Trading Economics
Mantic (mean)
50.11
Trading Economics
49.00BEST
Consensus
49.50
RMSE
Mantic (mean)
2.58
Trading Economics
0.25
Consensus
1.00
View Mantic Prediction Analysis
- I forecast the United States ISM Manufacturing PMI for May 2025 will be 50.0, indicating a return to the neutral threshold between expansion and contraction.
- My 80% confidence interval for the May 2025 PMI is 47.7 to 52.7, reflecting significant uncertainty due to mixed economic signals.
- The forecast for an expansionary reading is driven by the S&P Global Flash Manufacturing PMI, which jumped sharply to 52.3 in May 2025.
- This expected rebound is linked to "tariff front-running," a behavior that mechanically boosts the ISM index by increasing New Orders and extending Supplier Deliveries.
- Persistent weakness in underlying demand and production, as seen in the April PMI of 48.7 and contractionary regional surveys, provides a counter-balancing downward pressure on the headline index.
What will United States ISM Manufacturing PMI be for June 2025?
Actual Resolution: 49.00
Best RMSE: Trading Economics, Consensus
Mantic (mean)
48.66
Trading Economics
49.20TIE
Consensus
48.80TIE
RMSE
Mantic (mean)
0.113
Trading Economics
0.04
Consensus
0.04
View Mantic Prediction Analysis
- I forecast the June 2025 ISM Manufacturing PMI at 48.8, maintaining the index in contractionary territory for the fourth consecutive month.
- The forecast balances the contractionary trend (May PMI 48.5) and weak regional data (Philadelphia Fed index -4.0 in June) against the stable S&P Global Flash PMI (52.0).
- The ISM index is mechanically supported by an elevated Supplier Deliveries Index (May: 56.1), a factor driven by tariff-related supply chain friction.
- Persistent trade policy uncertainty is the primary headwind, cited by ISM panelists as creating supply chain disruptions and severely restricting new orders and employment.
- Major industrial firms like Caterpillar report falling Q1 2025 revenue and inventory build-up, signaling a material slowdown in industrial sector momentum.
What will United States ISM Manufacturing PMI be for July 2025?
Actual Resolution: 48.00
Best RMSE: Mantic
Mantic (mean)
48.27BEST
Trading Economics
49.40
Consensus
49.50
RMSE
Mantic (mean)
0.075
Trading Economics
1.96
Consensus
2.25
View Mantic Prediction Analysis
- The median forecast for the United States ISM Manufacturing PMI for July 2025 is 48.5 points, indicating the manufacturing sector remains in contraction.
- The June 2025 PMI reading was 49.0, continuing the contractionary trend that has persisted since March 2025.
- Leading indicators suggest a sudden loss of momentum in July, particularly the S&P Global Flash Manufacturing PMI, which dropped sharply to 49.5 from 52.9 in June.
- This sudden weakness is linked to the fading boost from tariff-driven "front-loading" of inventory purchases, creating a demand vacuum in late July.
- Regional surveys support this negative outlook; the Federal Reserve Bank of Richmond's Manufacturing Index plunged to -20 in July, indicating a severe contraction.
What will United States ISM Manufacturing PMI be for August 2025?
Actual Resolution: 48.70
Best RMSE: Consensus
Mantic (mean)
49.87
Trading Economics
48.20
Consensus
49.00BEST
RMSE
Mantic (mean)
1.38
Trading Economics
0.25
Consensus
0.09
View Mantic Prediction Analysis
- The median forecast for the US ISM Manufacturing PMI in August 2025 is 49.5 points, suggesting continued, but decelerating, contraction.
- The 50% confidence interval for the August 2025 ISM PMI spans 48.0 to 51.3 points.
- The forecast balances conflicting signals from August surveys; the S&P Global flash PMI surged to 53.3, but the ISM has a historical tendency to lag this measure.
- Underlying weakness is suggested by regional data, including the Philadelphia Fed Index dropping to -0.3 in August, signaling a sharp local contraction.
- Persistent softness in the labor market, with the July ISM Employment Index at 43.4, provides a significant headwind against a strong overall rebound.
What will United States ISM Manufacturing PMI be for September 2025?
Actual Resolution: 49.10
Best RMSE: Trading Economics, Consensus
Mantic (mean)
48.34
Trading Economics
49.00TIE
Consensus
49.00TIE
RMSE
Mantic (mean)
0.572
Trading Economics
0.01
Consensus
0.01
View Mantic Prediction Analysis
- I forecast the US ISM Manufacturing PMI for September 2025 at 48.5, indicating a continued contraction in the manufacturing sector.
- My 50% confidence interval for the September reading spans 47.4 to 49.7.
- This estimate suggests a slight decline from the 48.7 reported in August, supported by a loss of momentum in leading indicators.
- The S&P Global Flash Manufacturing PMI fell one point to 52.0 in September, and the Richmond Fed Manufacturing Index signaled severe regional weakness, crashing to -17.
- The modest expansion in August ISM New Orders (51.4) is unlikely to be sustained, as newer data indicates that new orders have already cooled to a marginal pace.
What will United States ISM Manufacturing PMI be for October 2025?
Actual Resolution: 48.70
Best RMSE: Trading Economics, Consensus
Mantic (mean)
49.63
Trading Economics
49.50TIE
Consensus
49.50TIE
RMSE
Mantic (mean)
0.864
Trading Economics
0.64
Consensus
0.64
View Mantic Prediction Analysis
- I forecast the United States ISM Manufacturing PMI for October 2025 will be 49.7, with a 50% confidence interval spanning from 48.5 to 51.1 points.
- The forecast's wide range reflects highly contradictory leading indicators for October, complicating the movement away from September’s 49.1 contractionary print.
- Positive signals include the S&P Global Flash PMI rising to 52.2 and the New York Fed (Empire State) Index surging to +10.7, indicating a potential return to expansion.
- These gains are countered by the Philadelphia Fed index plunging to -12.8 and S&P Global’s export orders sub-index falling to a six-month low of 47.8.
- The index remains constrained by persistent policy uncertainty regarding tariffs and ongoing supply chain disruptions, particularly in the domestic automotive sector.
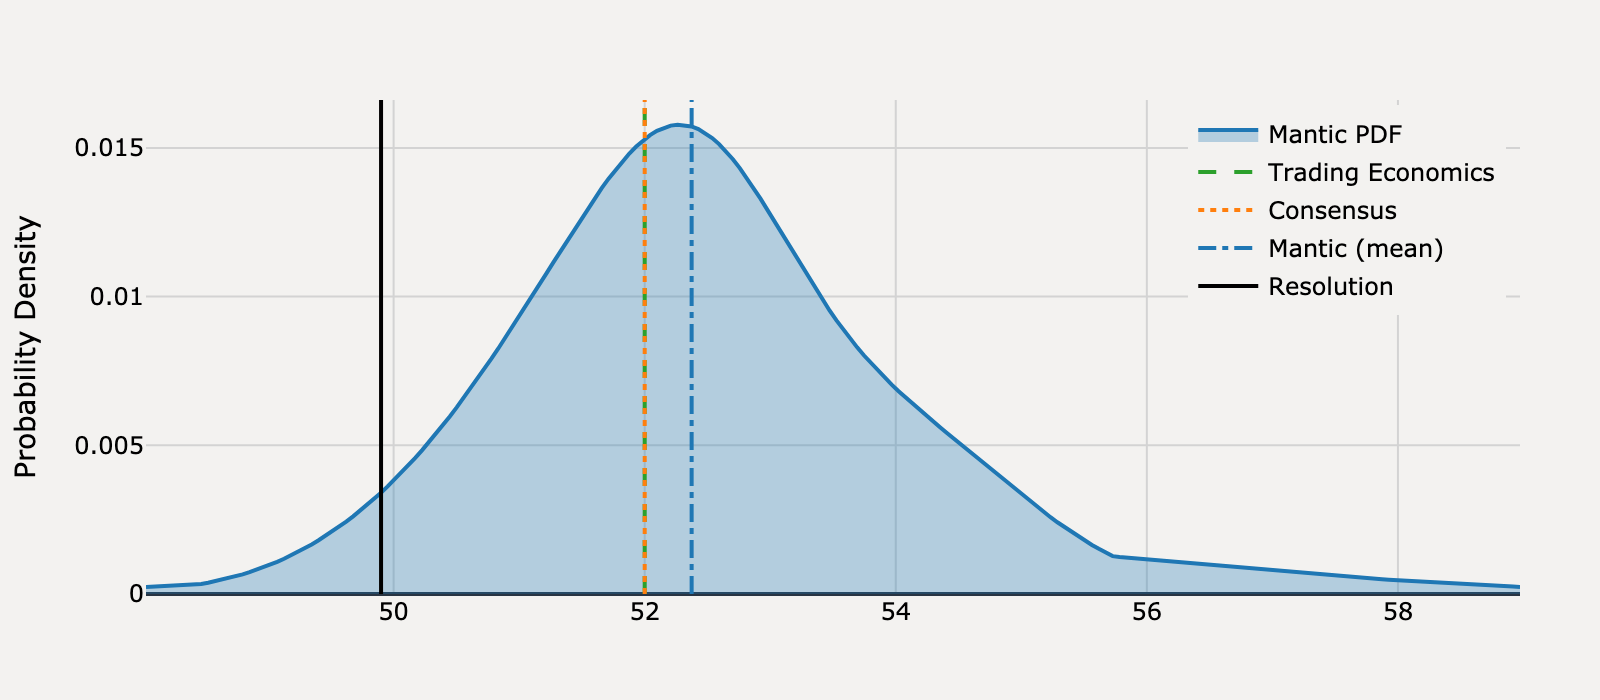
What will United States ISM Services PMI be for January 2025?
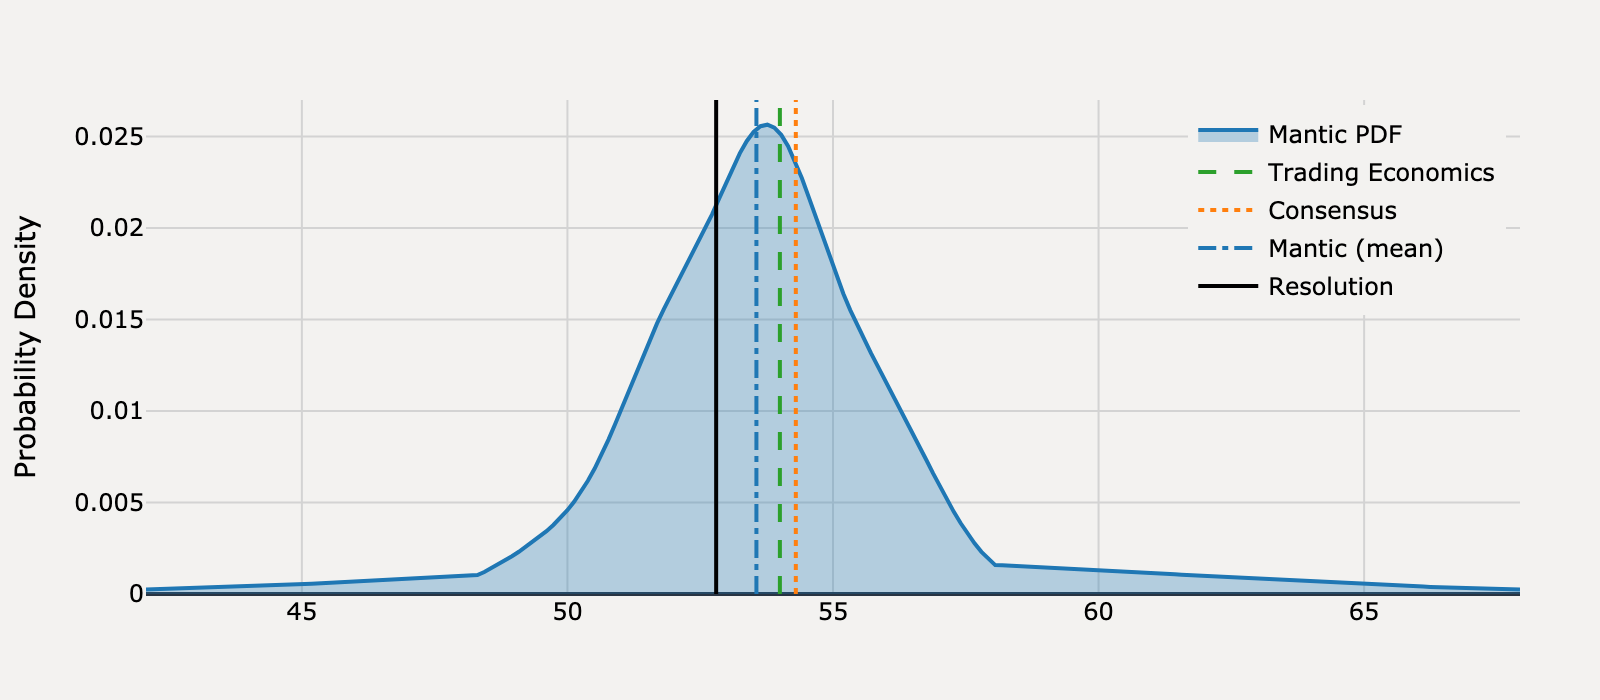
Actual Resolution: 52.80
Best RMSE: Mantic
Mantic (mean)
53.56BEST
Trading Economics
54.00
Consensus
54.30
RMSE
Mantic (mean)
0.575
Trading Economics
1.44
Consensus
2.25
View Mantic Prediction Analysis
- My forecast for the United States ISM Services PMI for January 2025 is 53.7.
- The ISM Services PMI reading for December 2024 was 54.1, indicating continued expansion.
- A modest cooling in activity is suggested by the S&P Global Flash U.S. Services PMI for January, which fell to a nine-month low of 52.8.
- The ISM implemented annual adjustments to seasonal factors effective in January 2025, which mechanistically influence the final adjusted composite score.
- Persistent price pressures remain a concern, with the ISM Services Prices Index hitting 64.4 in December, its highest level since February 2023.
What will United States ISM Services PMI be for February 2025?
Actual Resolution: 53.50
Best RMSE: Trading Economics
Mantic (mean)
51.04
Trading Economics
52.70BEST
Consensus
52.60
RMSE
Mantic (mean)
6.05
Trading Economics
0.64
Consensus
0.81
View Mantic Prediction Analysis
- I forecast the US ISM Services PMI for February 2025 will be 51.2 points, with a 50% confidence interval spanning 49.4 to 53.1 points.
- This represents a notable decline from the January reading of 52.8 and places the most probable outcome near the 50.0 stagnation threshold.
- The primary driver for the expected drop is the S&P Global Flash US Services PMI for February, which plunged to 49.7, signaling the first sector contraction in two years (Benzinga, MSN).
- The predicted slowdown is reinforced by a steep deterioration in sentiment, including the Conference Board Consumer Confidence Index recording its largest drop in 3.5 years in February (Reuters).
- The forecast median remains slightly above the S&P Flash result, accounting for the historical tendency of the ISM index to exhibit greater stability and sometimes register higher values than the S&P Global measure.
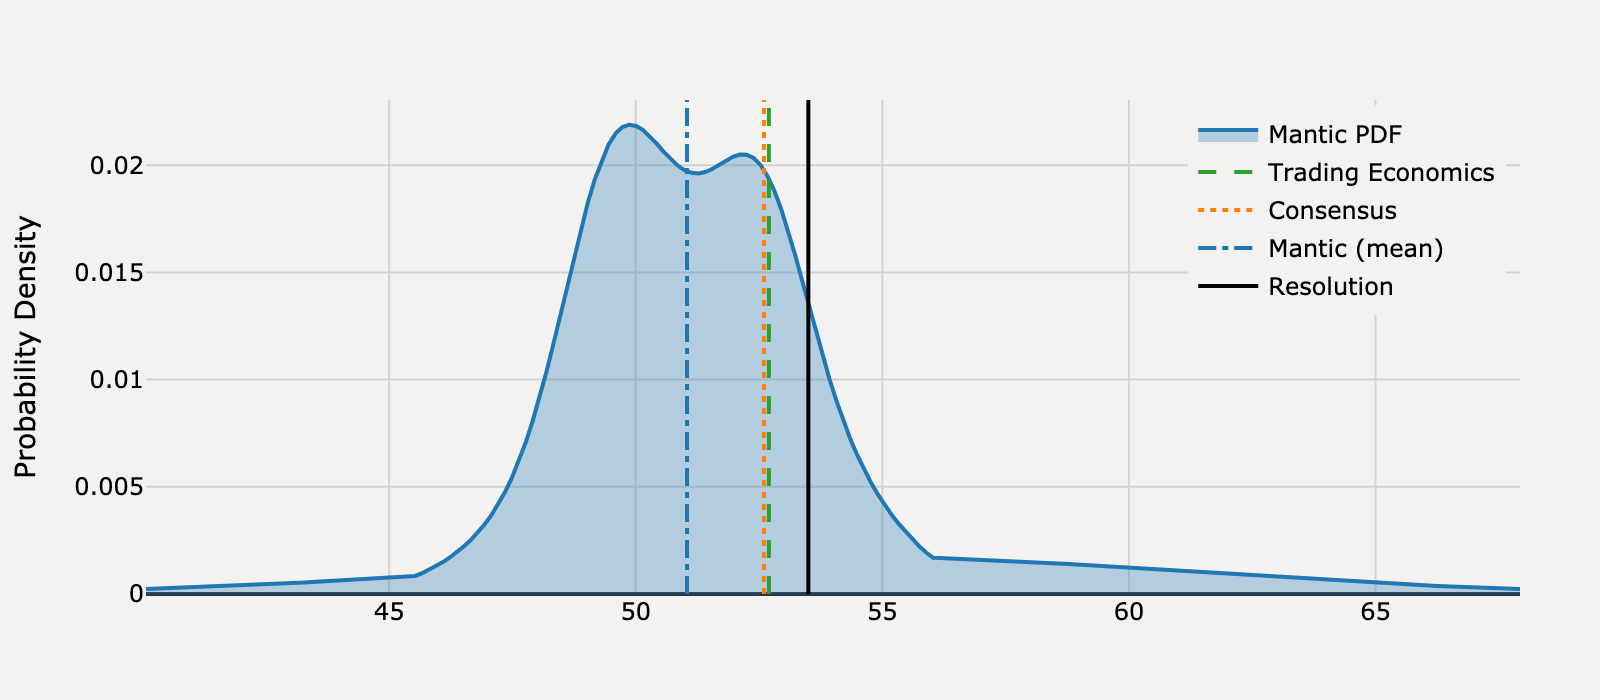
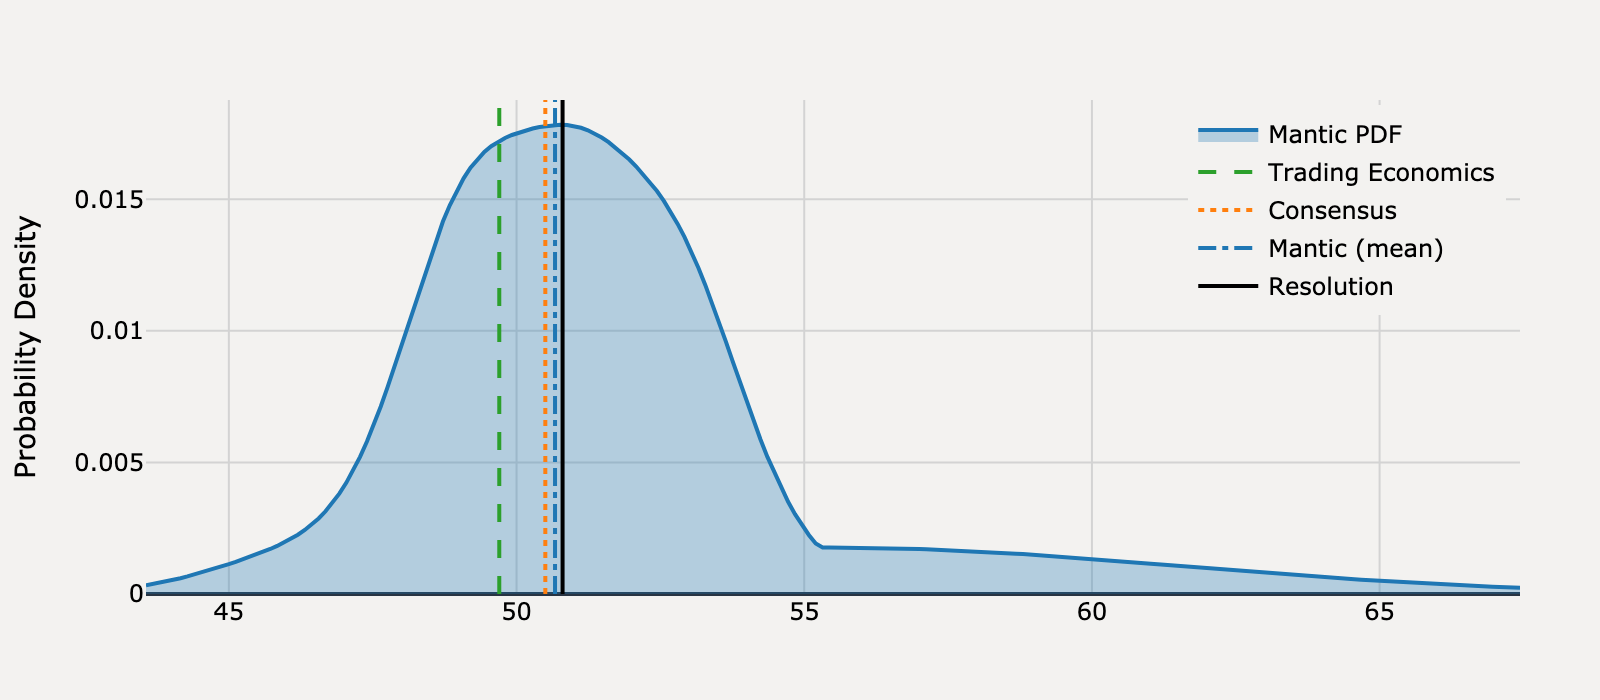
What will United States ISM Services PMI be for March 2025?
Actual Resolution: 50.80
Best RMSE: Trading Economics, Consensus
Mantic (mean)
53.50
Trading Economics
53.00TIE
Consensus
53.00TIE
RMSE
Mantic (mean)
7.27
Trading Economics
4.84
Consensus
4.84
View Mantic Prediction Analysis
- I forecast the United States ISM Services PMI for March 2025 will be 53.6, with a 50% confidence interval spanning from 52.5 to 54.6.
- The forecast centers on a continuation of moderate expansion, anchored by the previous official ISM Services PMI reading of 53.5 in February 2025.
- Strong positive momentum is signaled by the S&P Global Services PMI Flash for March, which surged to 54.3, suggesting robust growth in services activity.
- Inflationary pressure remains a factor, as the ISM Prices Index reached 62.6% in February, which mechanically supports a higher composite PMI reading.
- Significant downside risk comes from soft data, including a plunge in consumer confidence and reports that business anxiety over tariffs is leading to cuts in hiring and capital spending.
What will United States ISM Services PMI be for April 2025?
Actual Resolution: 51.60
Best RMSE: Consensus
Mantic (mean)
49.92
Trading Economics
50.30
Consensus
50.60BEST
RMSE
Mantic (mean)
2.83
Trading Economics
1.69
Consensus
1.00
View Mantic Prediction Analysis
- I estimate the US ISM Services PMI for April 2025 will be 50.4. The 50% confidence interval for this forecast spans 48.7 to 51.9.
- The March ISM PMI was 50.8, down from 53.5 in February, indicating a rapid loss of momentum in the services sector.
- The S&P Global Flash Services PMI for April fell sharply to 51.4, reinforcing the trend of slowing activity across the services sector.
- The services outlook is pressured by negative sentiment from regional surveys. The Philadelphia Fed Non-Manufacturing Index plummeted to -42.7 in April, its lowest reading since May 2020.
- Internal components of the March ISM report showed weakness, with the Employment Index (46.2) and Backlog of Orders Index (47.4) both in contraction territory.
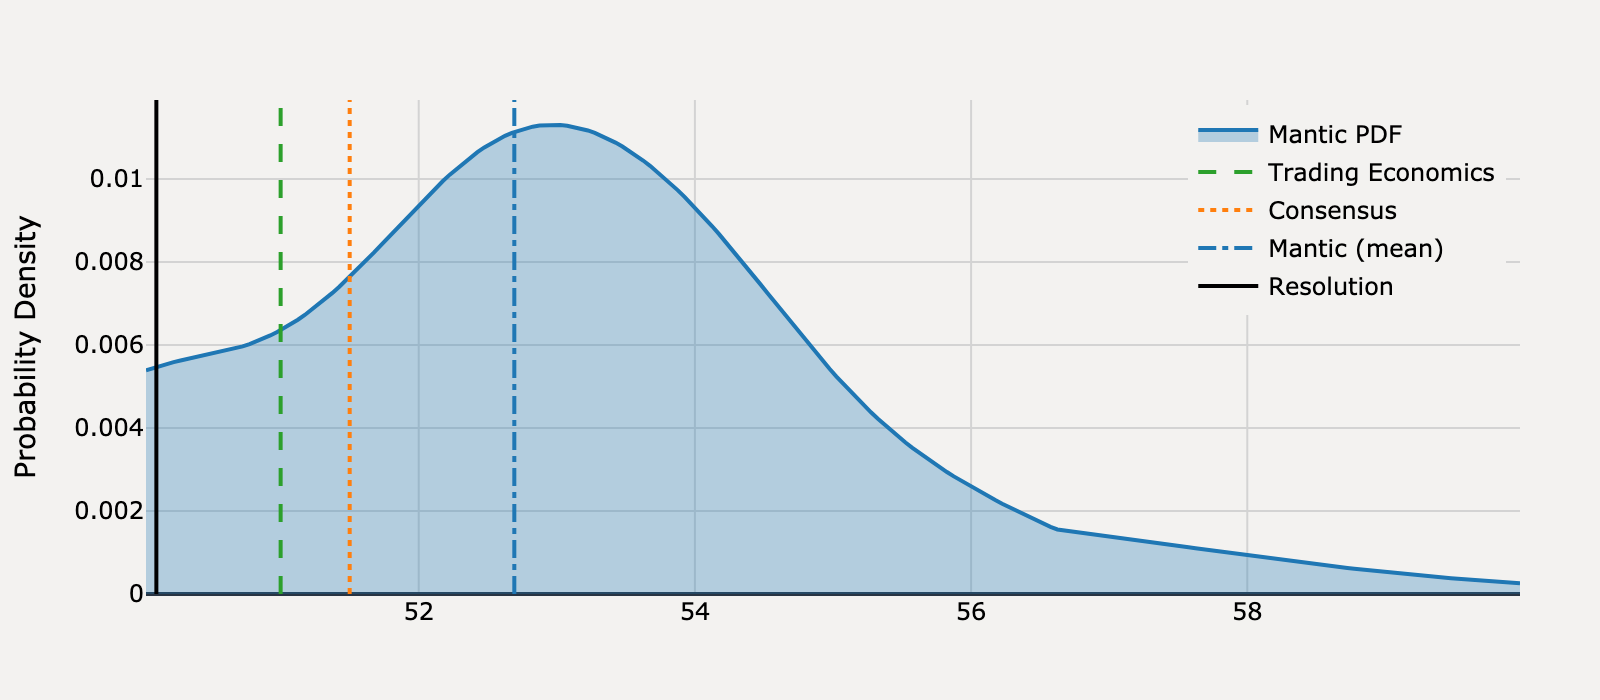
What will United States ISM Services PMI be for May 2025?
Actual Resolution: 49.90
Best RMSE: Trading Economics, Consensus
Mantic (mean)
52.37
Trading Economics
52.00TIE
Consensus
52.00TIE
RMSE
Mantic (mean)
6.12
Trading Economics
4.41
Consensus
4.41
View Mantic Prediction Analysis
- We forecast the US ISM Services PMI for May 2025 to be 52.4 (median), maintaining its streak of expansion (a reading above 50).
- This estimate follows a modest rise from 50.8 in March 2025 to 51.6 in April 2025.
- Primary indicators point to accelerating activity: the S&P Global Flash Services PMI for May reached 52.3, and the Conference Board Consumer Confidence Index surged to 98.0 in May.
- Near-term growth is mechanically boosted by businesses front-running potential tariffs by increasing orders and inventories, which positively influences the New Orders component.
- However, this expansion is constrained by persistent labor market weakness; employment sub-indices were in contraction in April (49.0) and remain weak in the May Flash data (49.5).
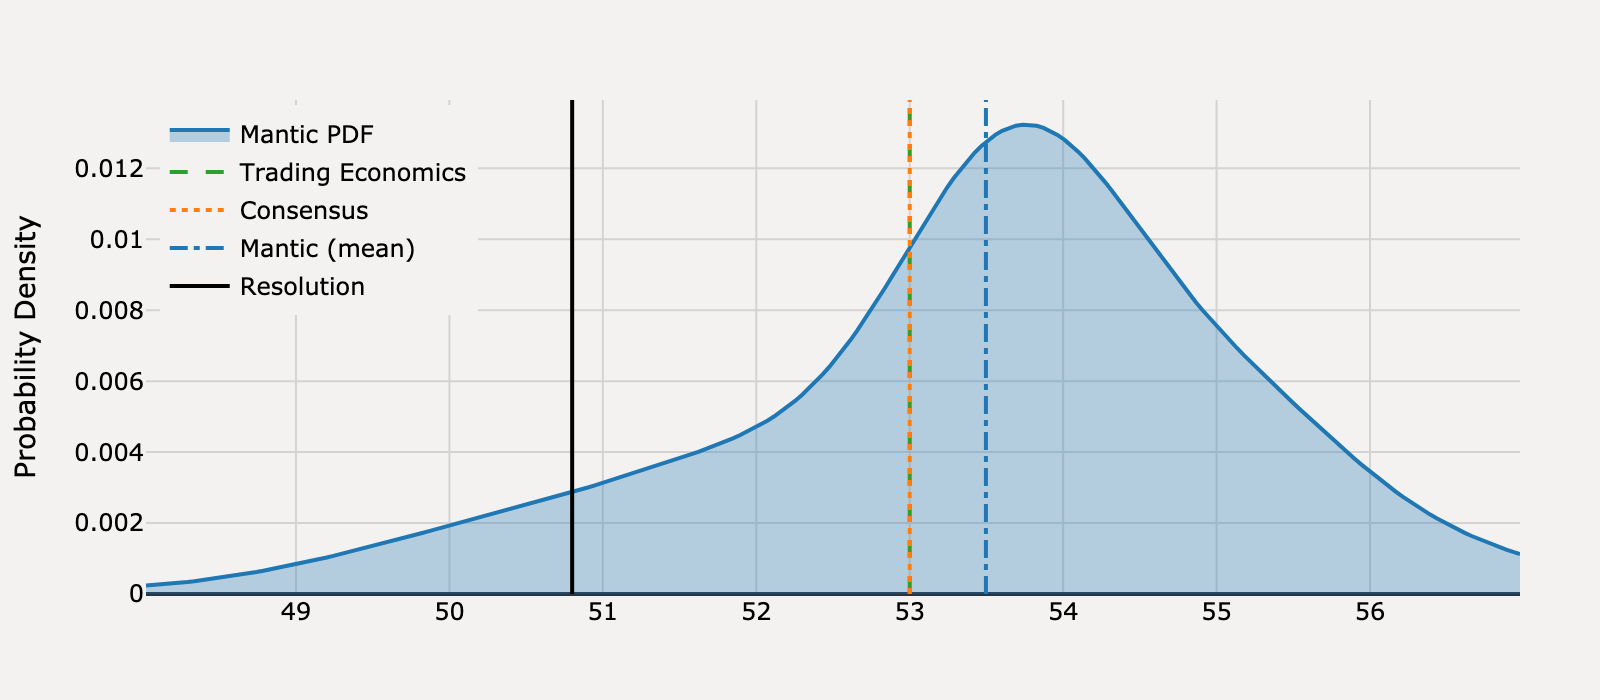
What will United States ISM Services PMI be for June 2025?
Actual Resolution: 50.80
Best RMSE: Mantic
Mantic (mean)
50.67BEST
Trading Economics
49.70
Consensus
50.50
RMSE
Mantic (mean)
0.017
Trading Economics
1.21
Consensus
0.09
View Mantic Prediction Analysis
- I estimate the US Non-Manufacturing PMI for June 2025 will be 50.7. The 50% confidence interval spans 49.2 to 53.0.
- The forecast balances the contraction signal from the official ISM index (49.9 in May) against the continued expansion reported by the S&P Global Services PMI (53.1 flash for June).
- Downside risk is driven by the sharp decline in the May ISM New Orders sub-index to 46.4, which suggests significant underlying demand weakness for June.
- Elevated inflationary pressures persist despite slowing activity, with the ISM Prices Paid index reaching 68.7 in May due to factors including tariffs.
- Broader indicators, including weak retail sales and lower consumer confidence in June, support a continued cooling trend toward a near-neutral reading.
What will United States ISM Services PMI be for July 2025?
Actual Resolution: 50.10
Best RMSE: Trading Economics
Mantic (mean)
52.69
Trading Economics
51.00BEST
Consensus
51.50
RMSE
Mantic (mean)
6.72
Trading Economics
0.81
Consensus
1.96
View Mantic Prediction Analysis
- The median forecast for the July 2025 ISM Services PMI is 52.9, an increase from the June reading of 50.8.
- The upward shift is strongly signaled by the S&P Global Flash US Services PMI for July, which jumped to a seven-month high of 55.2.
- The primary driver for the expected increase is the surge in business activity, attributed to firms front-loading purchases ahead of August 1 tariff increases.
- Upside momentum is tempered by structural labor weakness, with the ISM Services Employment Index remaining in contraction at 47.2 in June.
- Resilient U.S. consumer spending, supported by accelerating payment volumes through July, corroborates continued strength in the New Orders component.
What will United States ISM Services PMI be for August 2025?
Actual Resolution: 52.00
Best RMSE: Consensus
Mantic (mean)
50.88
Trading Economics
50.70
Consensus
51.00BEST
RMSE
Mantic (mean)
1.25
Trading Economics
1.69
Consensus
1.00
View Mantic Prediction Analysis
- I forecast the August 2025 ISM Services PMI to be 51.0 points, with a 50% confidence interval spanning from 49.8 to 52.7 points.
- The forecast balances the strong S&P Global Flash Services PMI reading of 55.4 for August against the weak recent trend of the official ISM Services PMI.
- The ISM Services PMI has hovered near the 50.0 expansion threshold, easing from 50.8 in June to 50.1 in July.
- The index faces persistent downward pressure from the labor market; the ISM Employment sub-component was in contraction at 46.4 in July.
- Price pressures remain acute, with the ISM Prices Index rising to 69.9% in July, its highest level since October 2022.
What will United States ISM Services PMI be for September 2025?
Actual Resolution: 50.00
Best RMSE: Trading Economics
Mantic (mean)
51.60
Trading Economics
51.00BEST
Consensus
51.70
RMSE
Mantic (mean)
2.56
Trading Economics
1.00
Consensus
2.89
View Mantic Prediction Analysis
- I predict the US ISM Services PMI for September 2025 will be 51.8 points, with a 50% confidence interval spanning 50.5 to 53.3 points.
- The forecast implies a modest slowdown from the August reading of 52.0, consistent with the directional change observed in the S&P Global Flash US Services PMI which cooled to 53.9 in September.
- The overall index is held down by the Employment component, which remained in contraction at 46.5 in August, reflecting the broader softening of the US labor market.
- Continued expansion is supported by the strong New Orders sub-index (56.0 in August), partially driven by companies front-loading activity due to anticipated tariff-related price increases.
What will United States ISM Services PMI be for October 2025?
Actual Resolution: 52.40
Best RMSE: Mantic
Mantic (mean)
52.06BEST
Trading Economics
50.80
Consensus
50.80
RMSE
Mantic (mean)
0.113
Trading Economics
2.56
Consensus
2.56
View Mantic Prediction Analysis
- I forecast the United States ISM Services PMI for October 2025 will be 52.1, reflecting a modest rebound into expansion territory from the September reading of 50.0.
- The forecast is supported by the S&P Global Flash Services PMI for October which printed 55.2, signaling strong and sustained growth in the services sector.
- The September ISM Services report showed persistent weakness in key areas, with the Employment sub-index contracting for the fourth straight month (47.2) and Business Activity at 49.9.
- This internal ISM weakness suggests the index will not fully converge with the significantly higher S&P Global figure, which is common due to methodological differences.
- Continued macroeconomic headwinds, including a decline in Michigan Consumer Sentiment to 53.6 in October, suggest underlying caution that will temper the rebound.
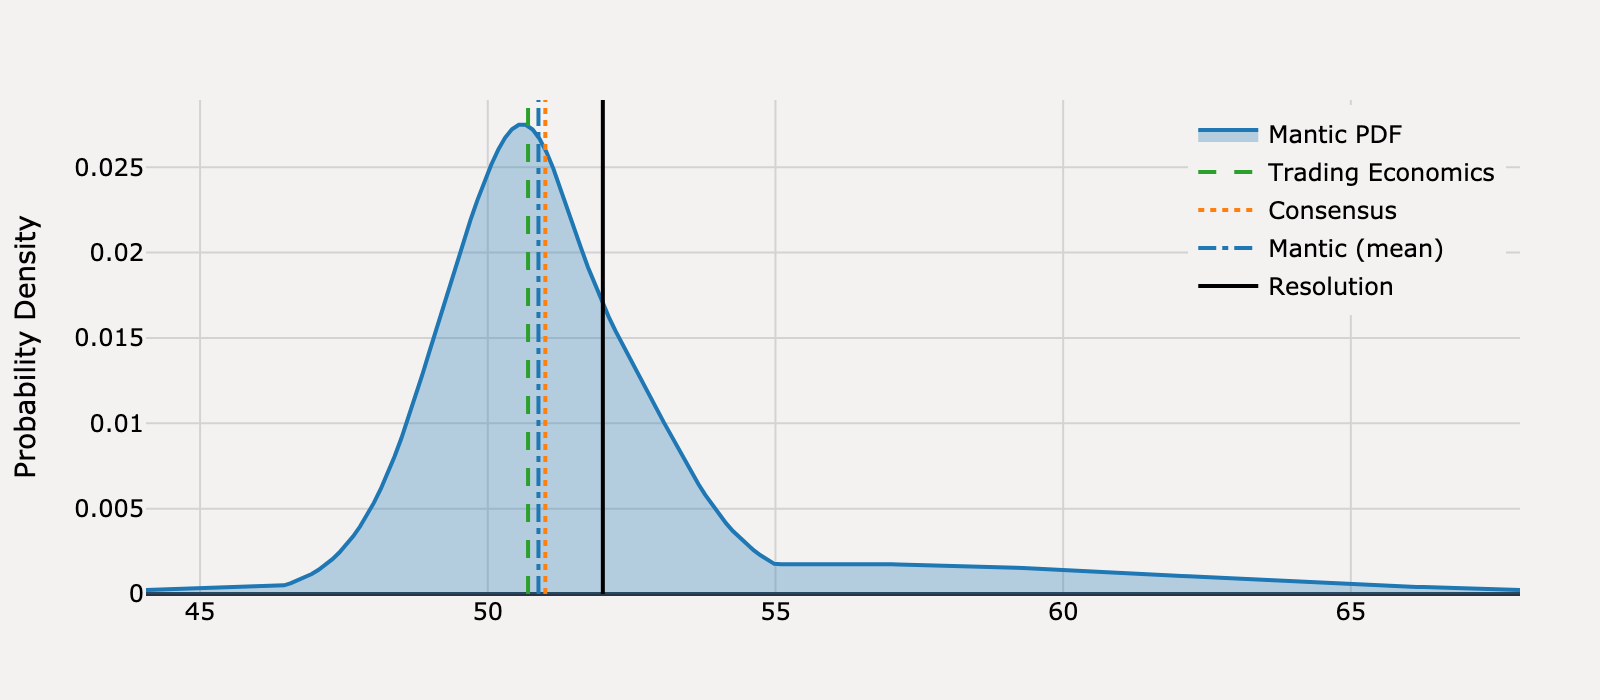
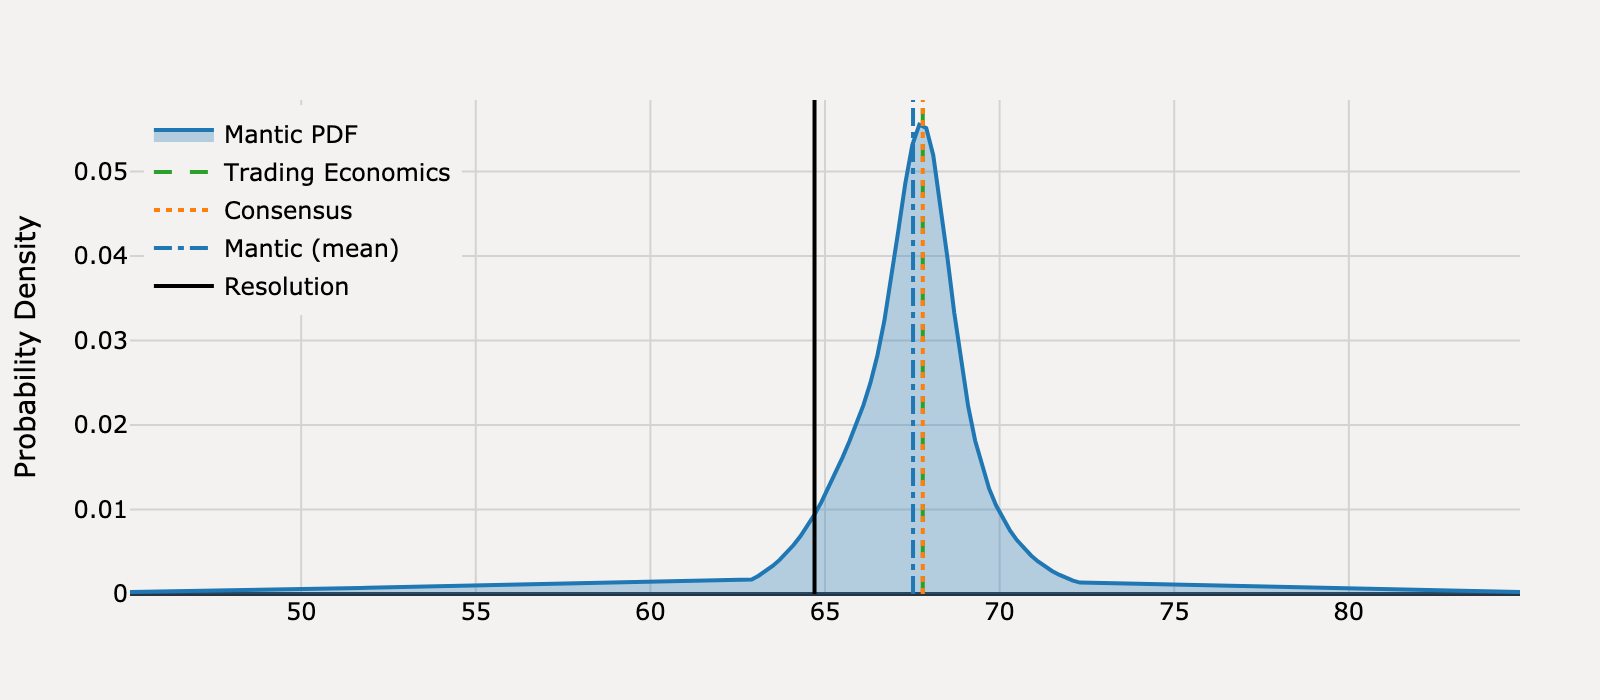
What will United States Michigan Consumer Sentiment be for January 2025?
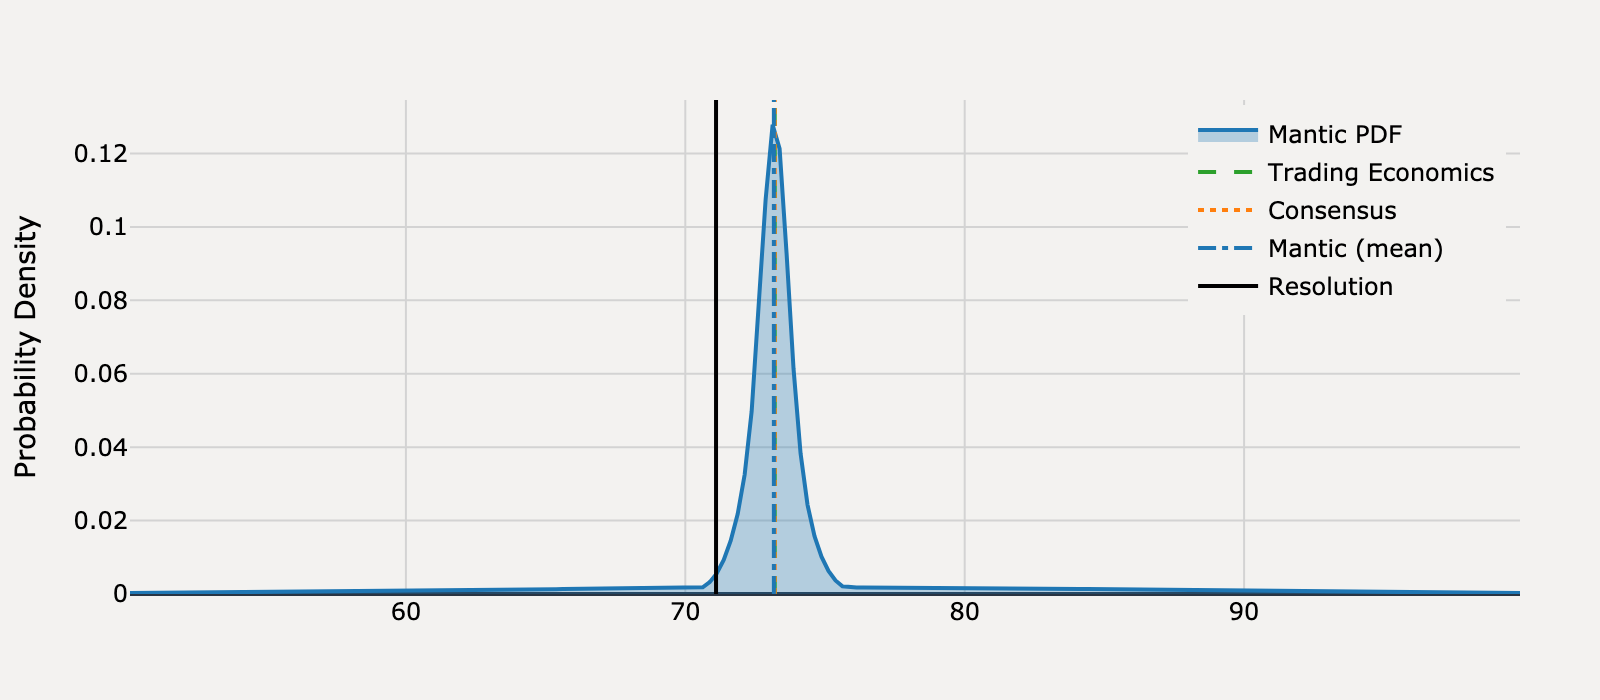
Actual Resolution: 71.10
Best RMSE: Mantic
Mantic (mean)
73.17BEST
Trading Economics
73.20
Consensus
73.20
RMSE
Mantic (mean)
4.29
Trading Economics
4.41
Consensus
4.41
View Mantic Prediction Analysis
- I predict the final University of Michigan Consumer Sentiment Index for January 2025 will be 73.2 points (median forecast).
- This forecast is anchored by the preliminary January value of 73.2, which is slightly below the final December 2024 reading of 74.0 points.
- The final index value is expected to be minimally revised from the preliminary print, as historical revisions are typically small and symmetric.
- The January preliminary data showed a jump in 5-10 year inflation expectations to 3.3%, the highest level since 2008, posing the main downside risk to sentiment.
- Sentiment is supported by robust underlying economic conditions, including a low 4.1% unemployment rate and solid December retail sales figures.
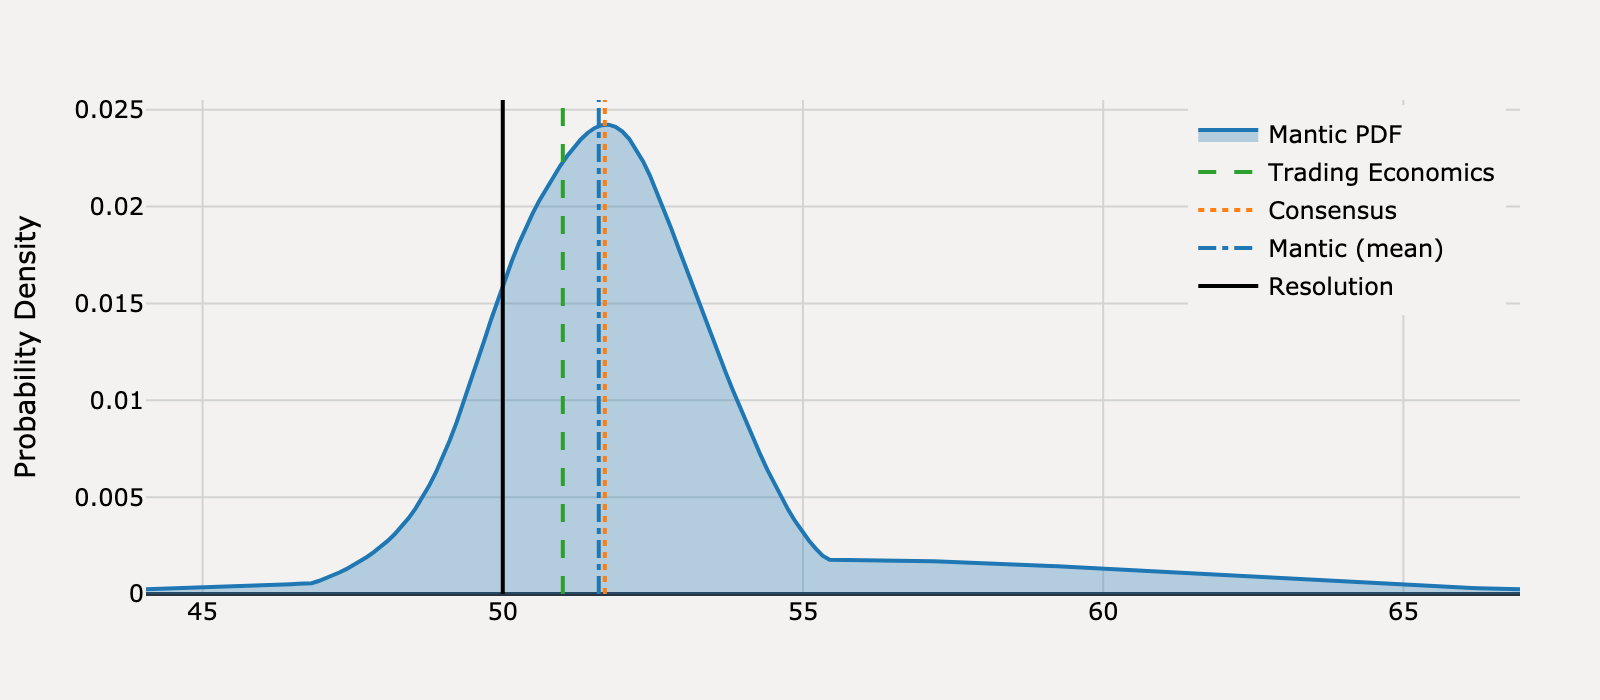
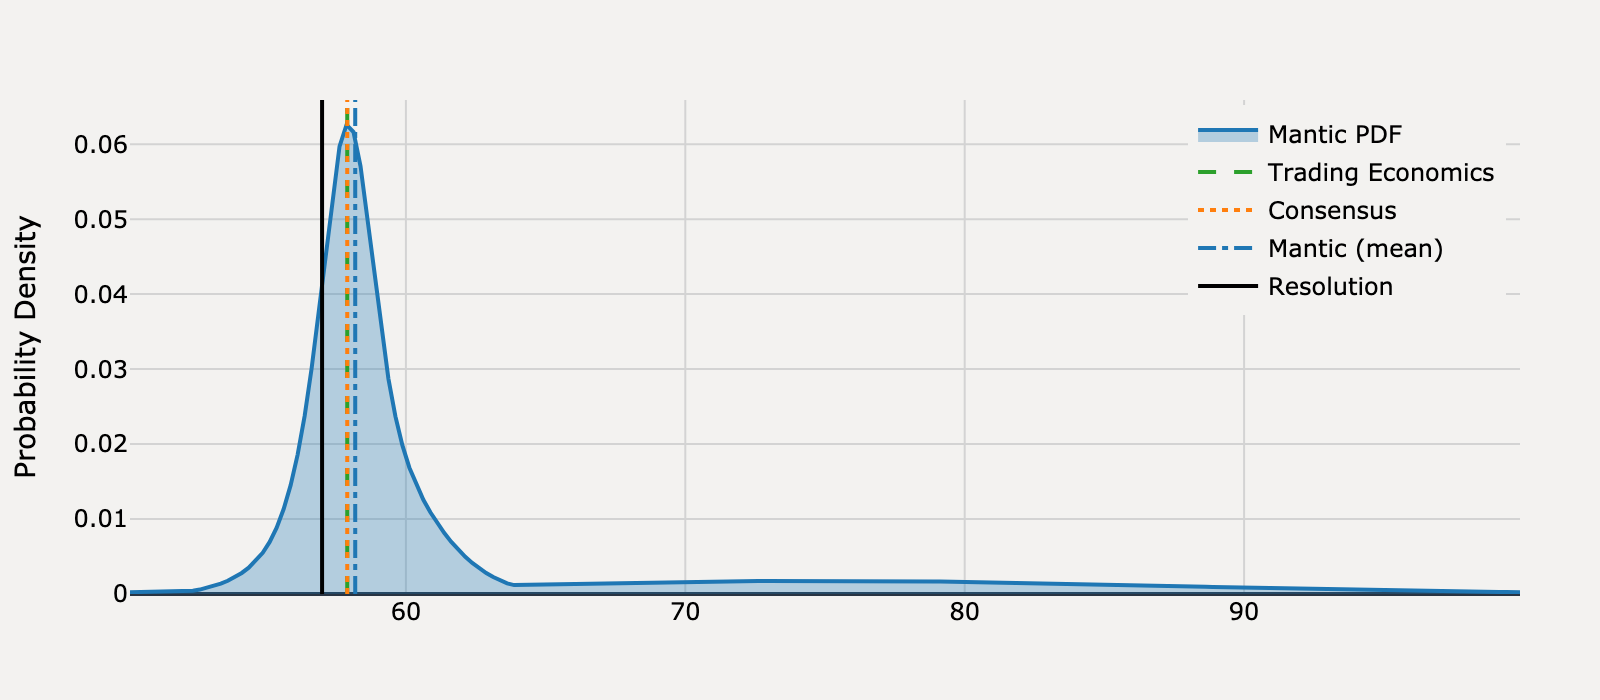
What will United States Michigan Consumer Sentiment be for February 2025?
Actual Resolution: 64.70
Best RMSE: Mantic
Mantic (mean)
67.52BEST
Trading Economics
67.80
Consensus
67.80
RMSE
Mantic (mean)
7.96
Trading Economics
9.61
Consensus
9.61
View Mantic Prediction Analysis
- I forecast the final United States Michigan Consumer Sentiment for February 2025 to be 67.5 points, with a 50% confidence interval spanning 66.1 to 68.6 points.
- The preliminary February 2025 reading of 67.8 points serves as the primary anchor, following the January 2025 final value of 71.1 points.
- The preliminary reading was driven down by a spike in 1-year consumer inflation expectations to 4.3%.
- A negative revision is likely because the "hotter than expected" January CPI report (+0.47% MoM) was released during the second half of the survey period, further depressing late-month sentiment.
- This expected downside revision aligns with the January 2025 data, which saw a 2.1-point drop between the preliminary and final figures.
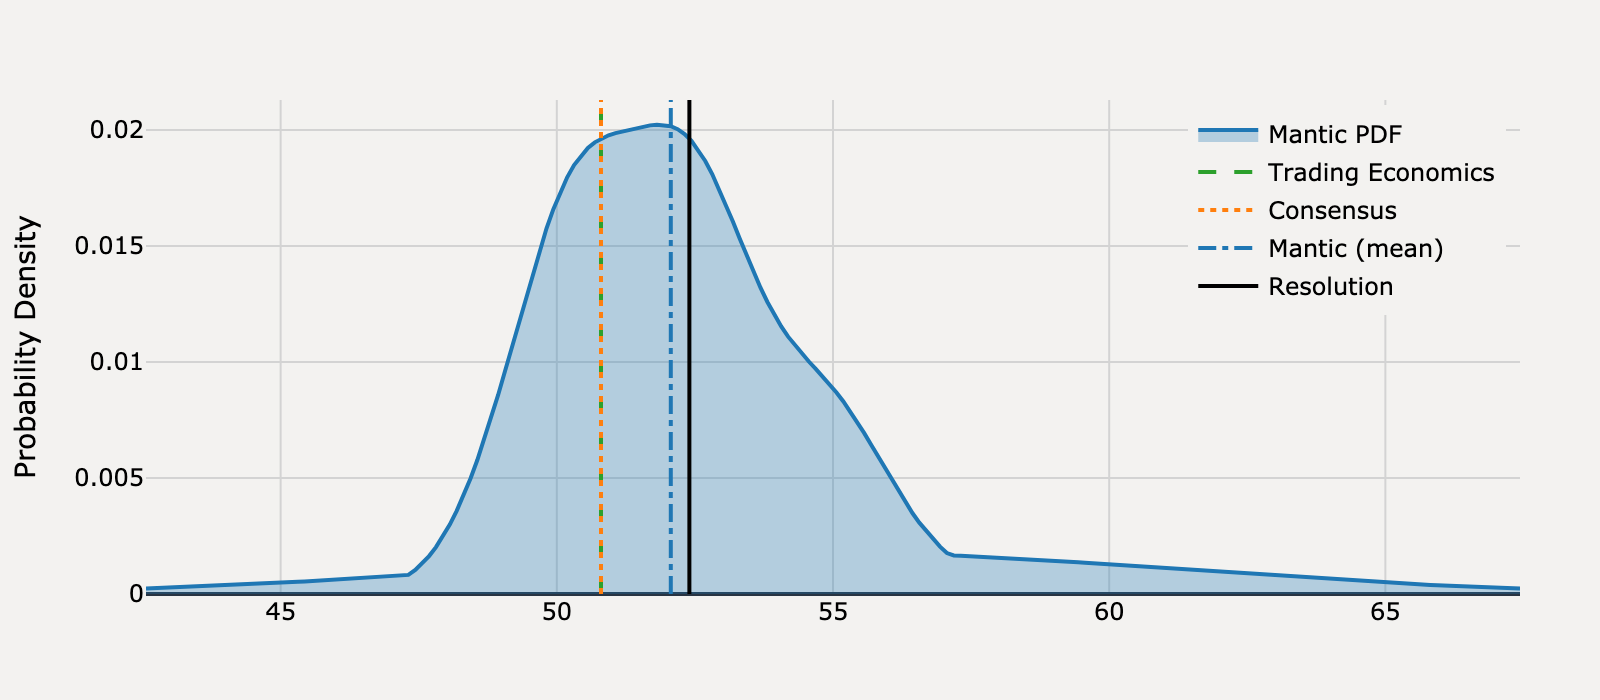
What will United States Michigan Consumer Sentiment be for March 2025?
Actual Resolution: 57.00
Best RMSE: Trading Economics, Consensus
Mantic (mean)
58.19
Trading Economics
57.90TIE
Consensus
57.90TIE
RMSE
Mantic (mean)
1.41
Trading Economics
0.81
Consensus
0.81
View Mantic Prediction Analysis
- I forecast the United States Michigan Consumer Sentiment Index for March 2025 to be 58.4 points, with the 50% confidence interval spanning 57.3 to 60.8 points.
- The forecast is strongly anchored to the preliminary March reading of 57.9, which represents a 10.5% drop from the February final reading of 64.7 points.
- The sharp decline in sentiment is attributed to a plunge in consumer expectations driven by high uncertainty over economic policy and recent tariff threats.
- Year-ahead inflation expectations surged to 4.9% in March, and the long-run expectation jumped 0.4 points to 3.9%, marking the largest monthly increase since 1993.
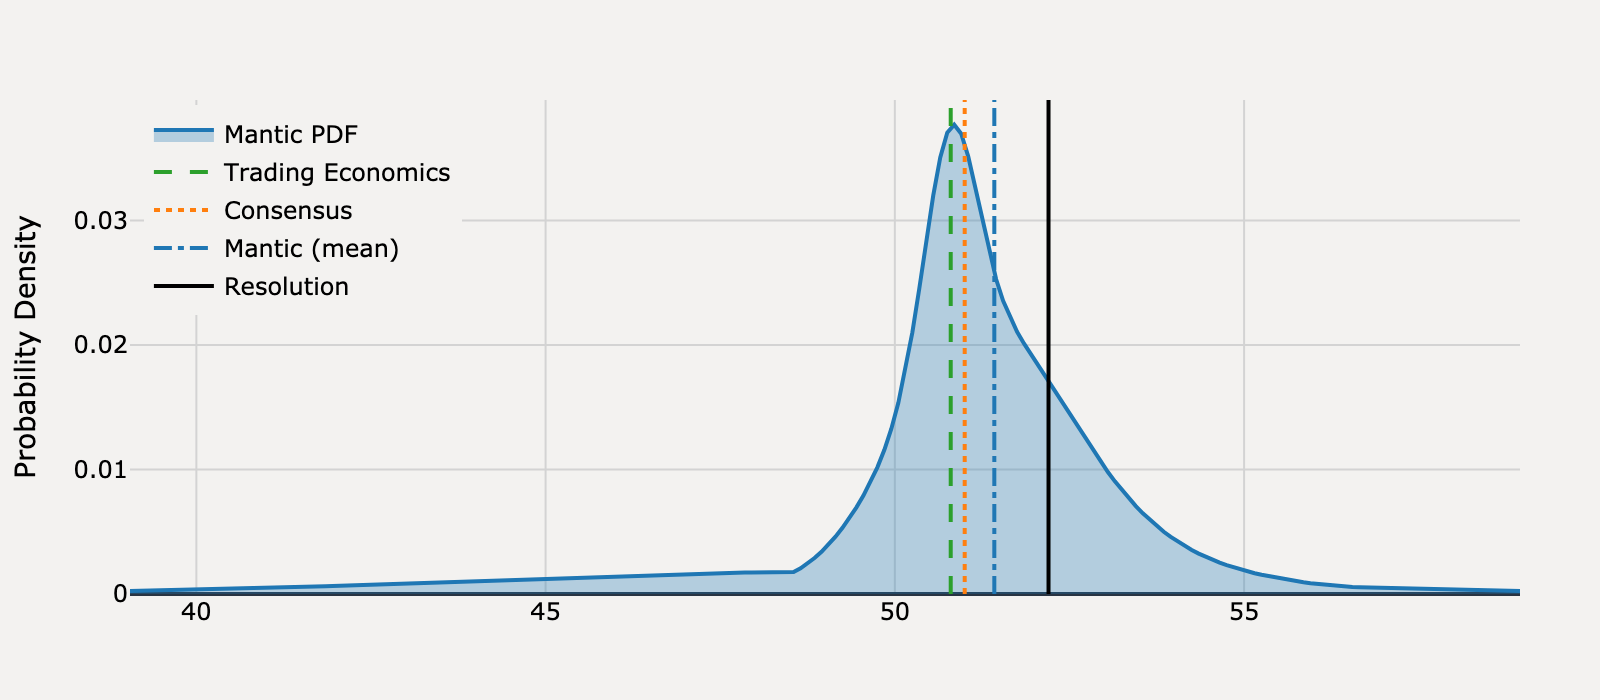
What will United States Michigan Consumer Sentiment be for April 2025?
Actual Resolution: 52.20
Best RMSE: Trading Economics, Consensus
Mantic (mean)
50.30
Trading Economics
50.80TIE
Consensus
50.80TIE
RMSE
Mantic (mean)
3.59
Trading Economics
1.96
Consensus
1.96
View Mantic Prediction Analysis
- I forecast the final University of Michigan Consumer Sentiment Index for April 2025 to be 50.8 points, which is the median estimate.
- The forecast is anchored by the preliminary April reading of 50.8, which typically predicts the final value with high accuracy.
- The sentiment dropped sharply from 57.0 in March due to "pervasive" consumer pessimism regarding new tariffs and mounting recession fears (Reuters, Yahoo).
- One-year inflation expectations surged to a preliminary 6.7% in April, the highest level since 1981, severely depressing the consumer outlook (MSN, Yahoo).
- There is a significant downside risk, with a 25% probability the final index falls to 50.0 points or lower, challenging the historical low set in June 2022.
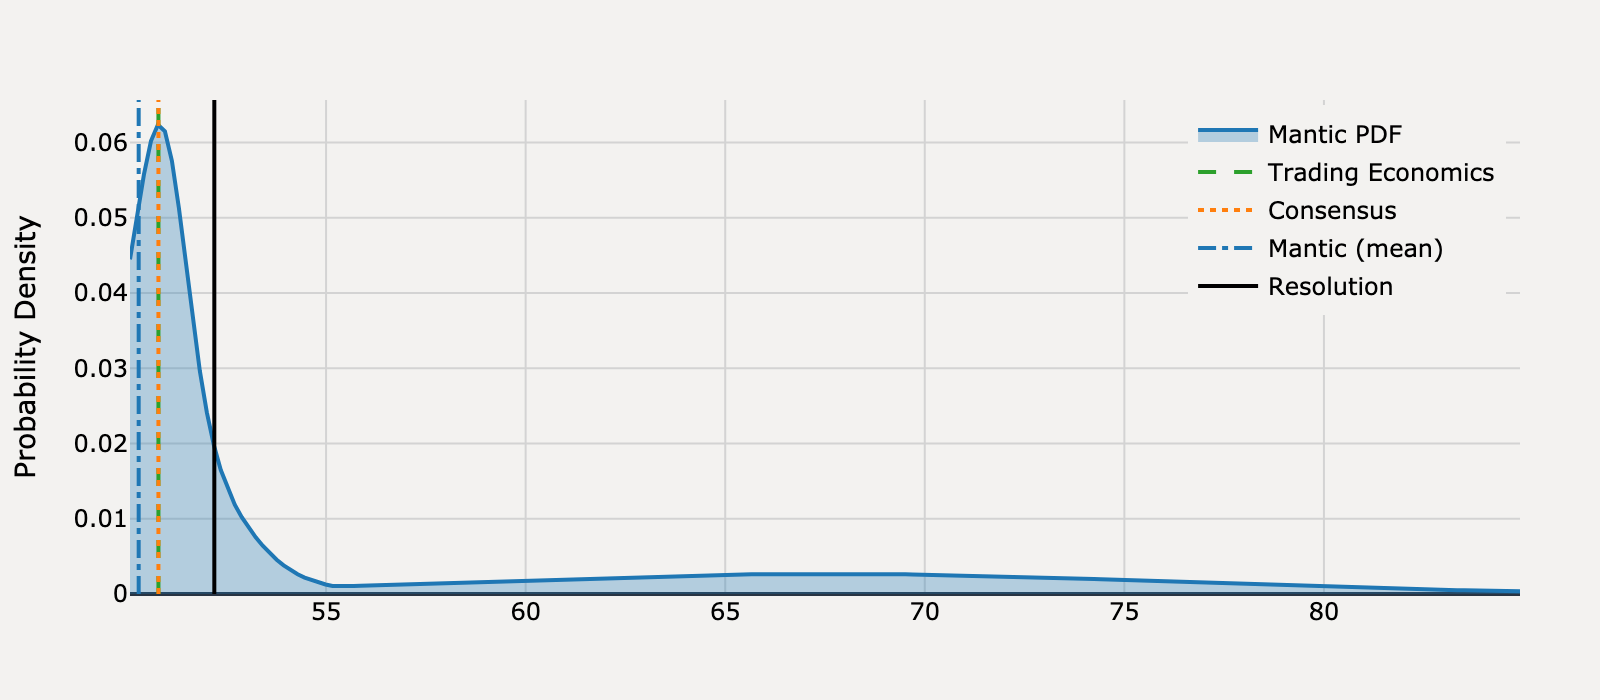
What will United States Michigan Consumer Sentiment be for May 2025?
Actual Resolution: 52.20
Best RMSE: Mantic
Mantic (mean)
51.42BEST
Trading Economics
50.80
Consensus
51.00
RMSE
Mantic (mean)
0.602
Trading Economics
1.96
Consensus
1.44
View Mantic Prediction Analysis
- I estimate the final University of Michigan Consumer Sentiment for May 2025 will be 51.1 points. My 50% confidence interval spans from 50.3 to 52.2.
- The forecast is anchored near the preliminary May reading of 50.8 points, reflecting a continuous decline for five months and approaching the historical low of 50.0 in June 2022.
- The principal mechanistic driver of low consumer sentiment is surging inflation expectations, with the May preliminary reading showing one-year expectations at 7.3%, the highest level since 1981.
- I place weight on a modest upward revision from the preliminary 50.8, following the pattern of the April 2025 final index which saw a +1.4 point revision to 52.2.
- This decline in confidence is occurring despite a stable US unemployment rate of 4.2% in April, indicating anxiety is primarily focused on prices and future economic outlook.
What will United States Michigan Consumer Sentiment be for June 2025?
Actual Resolution: 60.70
Best RMSE: Trading Economics, Consensus
Mantic (mean)
60.21
Trading Economics
60.50TIE
Consensus
60.50TIE
RMSE
Mantic (mean)
0.244
Trading Economics
0.04
Consensus
0.04
View Mantic Prediction Analysis
- I forecast the final US Michigan Consumer Sentiment Index for June 2025 to be 60.5 points, with a 50% confidence interval spanning 58.7 to 61.5 points.
- The forecast is anchored on the June preliminary reading of 60.5, which represents a significant 8.3-point increase from the May final value of 52.2 points.
- The sharp rebound in sentiment is primarily attributed to consumers stabilizing after the tariff shock and a plunge in year-ahead inflation expectations to 5.1% (down from 6.6% in May).
- The final reading, due June 27, may see a downward revision due to recently reported economic headwinds.
- Specifically, May U.S. retail sales contracted 0.9% month-over-month, and the consumer outlook for lower-income households soured in June, creating downside risk.
What will United States Michigan Consumer Sentiment be for July 2025?
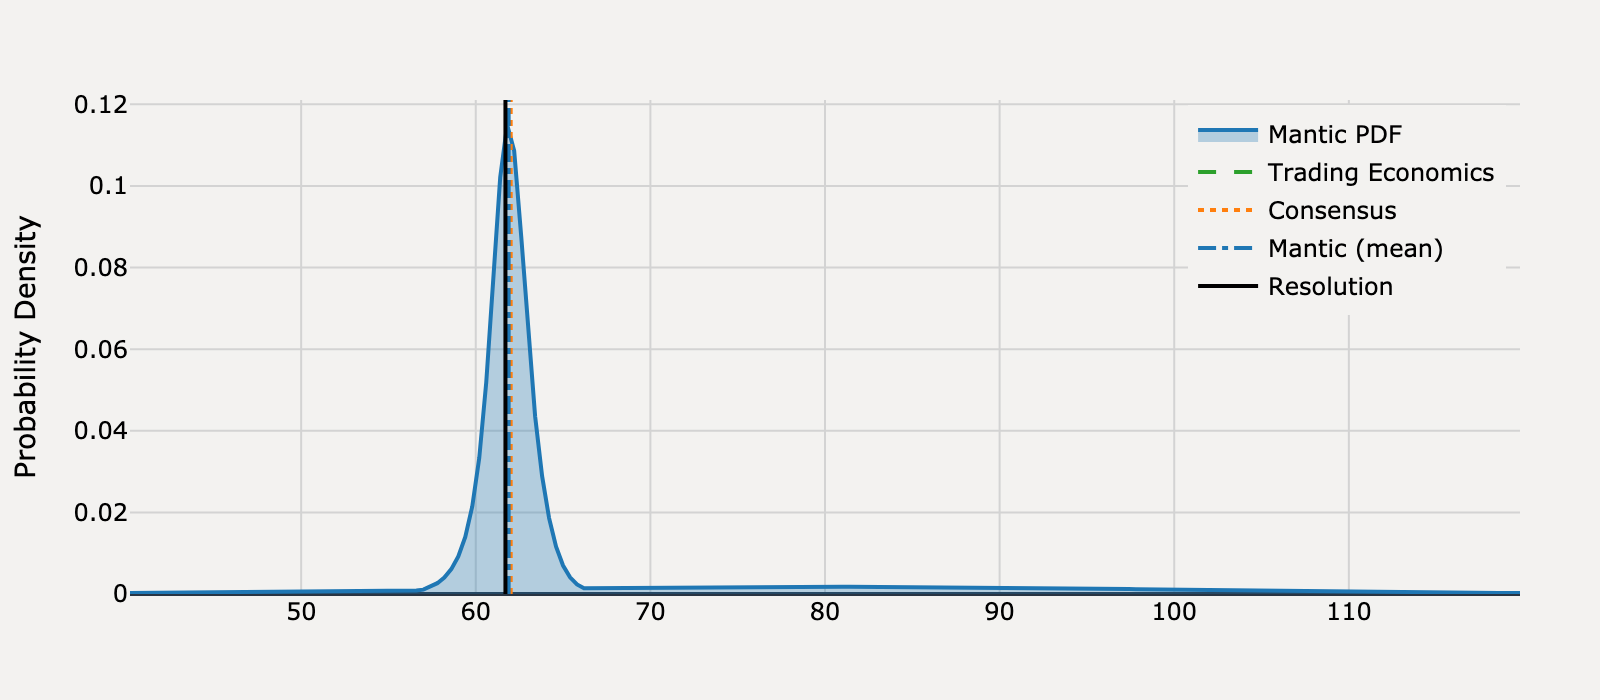
Actual Resolution: 61.70
Best RMSE: Trading Economics
Mantic (mean)
61.88
Trading Economics
61.80BEST
Consensus
62.00
RMSE
Mantic (mean)
0.033
Trading Economics
0.01
Consensus
0.09
View Mantic Prediction Analysis
- I estimate the final University of Michigan Consumer Sentiment Index for July 2025 will be 62.1.
- The 50% confidence interval for the final value spans 61.2 to 63.6 points.
- This forecast is tightly anchored to the preliminary July 2025 reading of 61.8, as historical data shows that final revisions typically deviate by less than two points.
- The index improvement is primarily driven by easing inflation fears, with year-ahead inflation expectations falling to 4.4% in the preliminary July survey from 5.0% in June.
- Despite the improved sentiment, financial data from major retailers shows cooling consumer activity, evidenced by a sharp slowdown in year-over-year revenue growth for companies like Walmart and Target.
What will United States Michigan Consumer Sentiment be for August 2025?
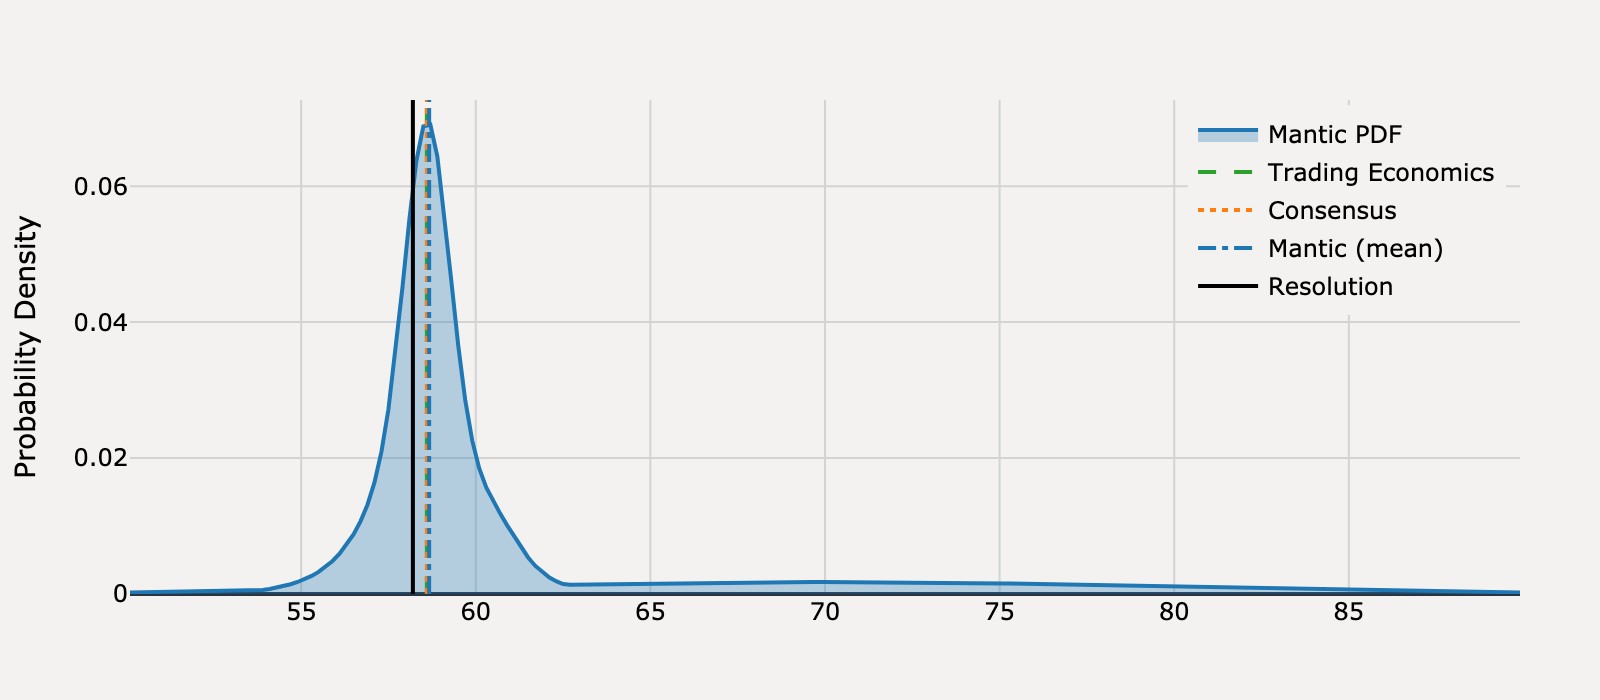
Actual Resolution: 58.20
Best RMSE: Trading Economics, Consensus
Mantic (mean)
58.67
Trading Economics
58.60TIE
Consensus
58.60TIE
RMSE
Mantic (mean)
0.217
Trading Economics
0.16
Consensus
0.16
View Mantic Prediction Analysis
- My forecast for the United States Michigan Consumer Sentiment Index in August 2025 is centered at 58.9, with a 50% confidence interval spanning 57.0 to 60.4 points.
- The forecast is anchored by the preliminary August 2025 reading of 58.6, which represents a significant decline from the final July value of 61.7 points.
- This monthly drop is mechanistically driven by heightened consumer anxiety over inflation and tariff-driven price increases, with 1-year inflation expectations rising to 4.9% in August from 4.5% in July.
- Despite the fragile consumer mood, actual spending remains robust; payment processors (Visa, Mastercard) report resilient payment volumes, and major retailers (Walmart) posted strong year-over-year revenue growth of 4.76% in Q2 2025.
- Final readings typically revise modestly from the preliminary data (within 1-2 points), suggesting little probability of a major deviation from the 58.6 anchor point.
What will United States Michigan Consumer Sentiment be for September 2025?

Actual Resolution: 55.10
Best RMSE: Trading Economics, Consensus
Mantic (mean)
55.62
Trading Economics
55.40TIE
Consensus
55.40TIE
RMSE
Mantic (mean)
0.274
Trading Economics
0.09
Consensus
0.09
View Mantic Prediction Analysis
- My median forecast for the final University of Michigan Consumer Sentiment Index for September 2025 is 55.8 points, with a 50% confidence interval ranging from 54.9 to 57.6.
- The forecast is anchored near the preliminary September reading of 55.4, which reflects a sharp decline from the August final reading of 58.2.
- The decline in sentiment was initially driven by increased consumer fears over labor market conditions and persistent year-ahead inflation expectations, which remained high at 4.8%.
- An upward revision from the preliminary 55.4 is expected due to positive economic news following the initial data collection cutoff. This includes the Federal Reserve's 25 basis point rate cut on September 17 and the concurrent U.S. stock market reaching all-time highs.
- Despite the potential upward revision, a value of 55.8 remains near historical lows, significantly below the index's long-run mean of 84.94, signaling deep pessimism about the economic outlook.
What will United States Michigan Consumer Sentiment be for October 2025?
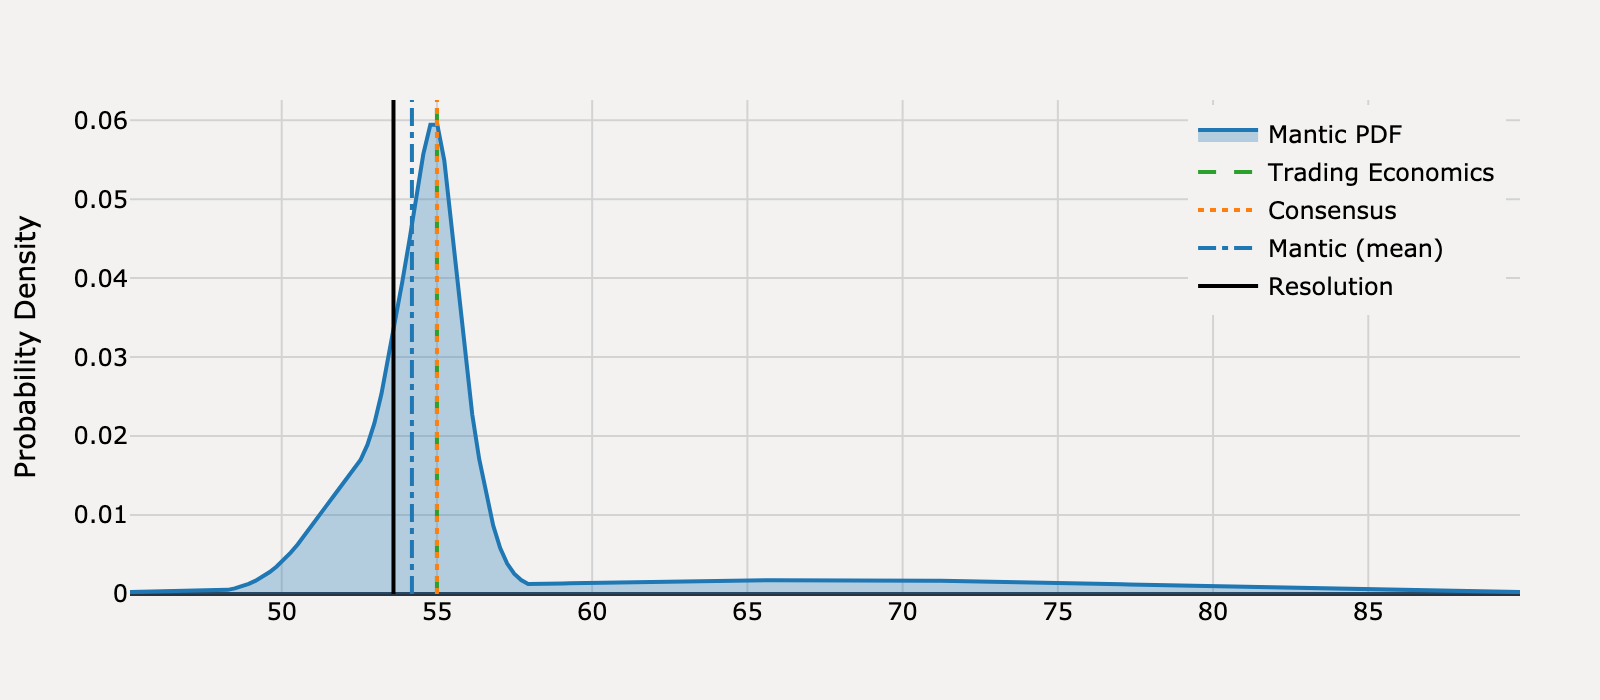
Actual Resolution: 53.60
Best RMSE: Mantic
Mantic (mean)
54.19BEST
Trading Economics
55.00
Consensus
55.00
RMSE
Mantic (mean)
0.353
Trading Economics
1.96
Consensus
1.96
View Mantic Prediction Analysis
- I forecast the United States Michigan Consumer Sentiment Index for October 2025 will be 54.8 points. The 50% confidence interval spans 53.5 to 56.1 points.
- The estimate is slightly below the final September 2025 reading of 55.1 points and the preliminary October reading of 55.0 points.
- The forecast reflects an anticipated downward revision from the preliminary figure due to the ongoing federal government shutdown, which was in its third week during the later collection period of the final survey.
- Consumer sentiment remains structurally low, near the 12-month minimum of 52.2 points recorded in May 2025.
- This low confidence is sustained by consumer pessimism regarding future personal finances and employment, despite high-income consumer resilience and strong results from major retailers.
What will United States Non Farm Payrolls be for January 2025?
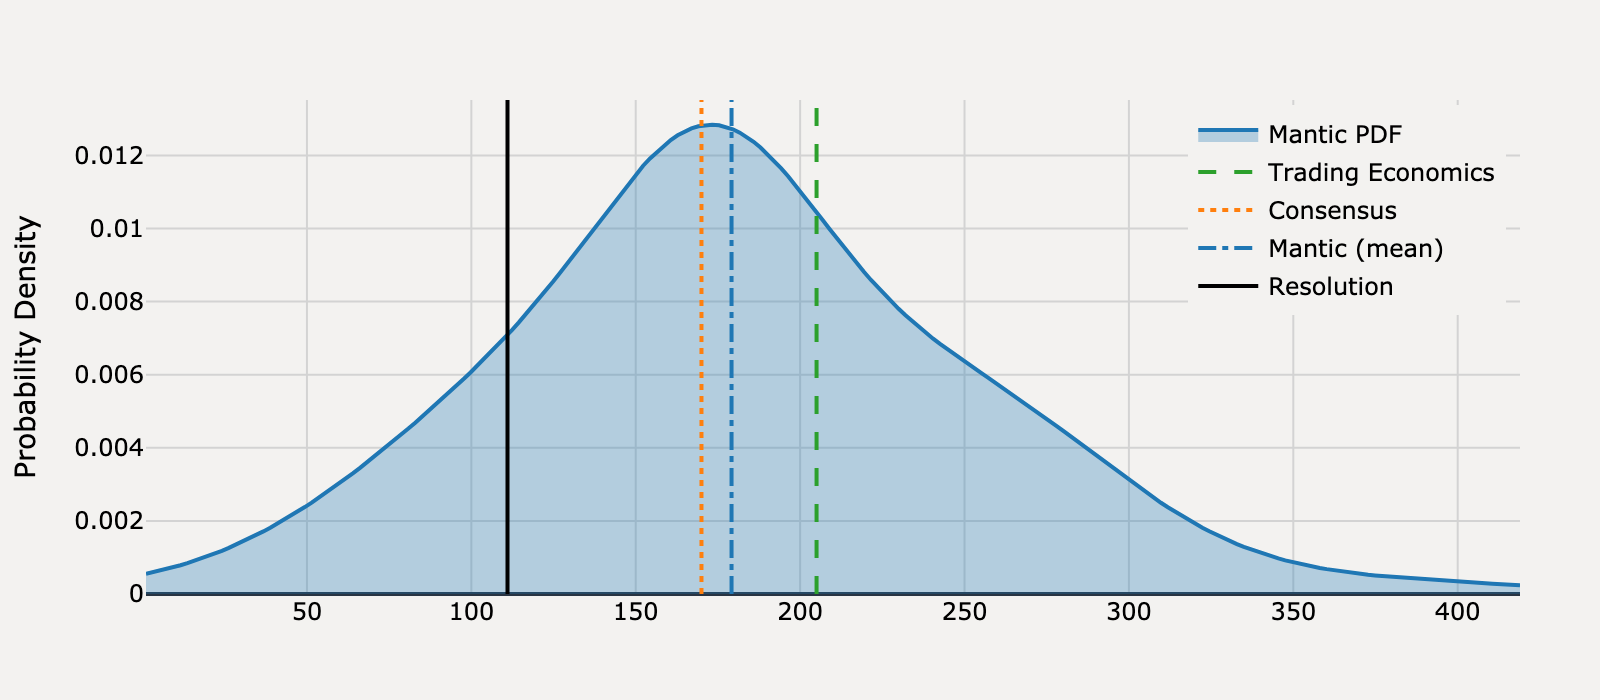
Actual Resolution: 111.0
Best RMSE: Consensus
Mantic (mean)
179.1
Trading Economics
205.0
Consensus
170.0BEST
RMSE
Mantic (mean)
4,643
Trading Economics
8,836
Consensus
3,481
View Mantic Prediction Analysis
- I forecast the United States Non-Farm Payrolls gain for January 2025 to be 178 thousand. My 80% confidence interval ranges from 80 thousand to 288 thousand.
- The forecast is slightly above the 170 thousand market consensus, reflecting a persistent underlying resilience in the labor market.
- Initial jobless claims remain historically low at 207 thousand, indicating employers are primarily retaining existing staff rather than initiating major layoffs.
- The strong December 2024 NFP print of 256 thousand suggests positive momentum, though this is tempered by cooling indicators from small business employment and temporary staffing firms.
- The prediction's uncertainty is high because the January NFP release incorporates annual benchmark and seasonal factor revisions that can generate significant volatility.
What will United States Non Farm Payrolls be for February 2025?
Actual Resolution: 102.0
Best RMSE: Mantic
Mantic (mean)
133.7BEST
Trading Economics
150.0
Consensus
160.0
RMSE
Mantic (mean)
1,004
Trading Economics
2,304
Consensus
3,364
View Mantic Prediction Analysis
- I forecast the United States Non-Farm Payrolls (NFP) for February 2025 will be 139,000 (median), slightly below the revised January reading of 143,000.
- The full negative impact of federal workforce reductions is largely deferred to the March report, as the BLS reference week (Feb 9-15) precedes the effective dates of most mass firings and deferred resignations.
- The labor market continues its cooling trend, evidenced by declining job openings (JOLTS fell to 7.6 million in December 2024) and a recent spike in weekly Initial Jobless Claims to 242,000.
- The forecast aligns closely with the 133,000 Reuters consensus and reflects slower private sector hiring due to widespread political and economic uncertainty.
What will United States Non Farm Payrolls be for March 2025?
Actual Resolution: 120.0
Best RMSE: Consensus
Mantic (mean)
140.1
Trading Economics
100.0
Consensus
135.0BEST
RMSE
Mantic (mean)
405.2
Trading Economics
400.0
Consensus
225.0
View Mantic Prediction Analysis
- I forecast that United States Non-Farm Payrolls (NFP) increased by 144,000 in March 2025, with a 50% confidence interval spanning 101,000 to 197,000.
- The forecast is centered near the market consensus of 135,000, slightly below the 151,000 job gain reported for February 2025.
- A strong services sector supports continued hiring, evidenced by the S&P Global Services PMI surging to 54.3 in March.
- However, specific policy-driven headwinds are expected to decelerate NFP growth, including anticipated federal job cuts of 60,000 to 75,000 hitting the March report.
- Further drag is indicated by the February ADP report showing only 77,000 private sector jobs added and widespread private-sector hiring freezes due to tariff uncertainty.
What will United States Non Farm Payrolls be for April 2025?
Actual Resolution: 158.0
Best RMSE: Trading Economics
Mantic (mean)
133.6
Trading Economics
140.0BEST
Consensus
130.0
RMSE
Mantic (mean)
596.8
Trading Economics
324.0
Consensus
784.0
View Mantic Prediction Analysis
- I predict US Non-Farm Payrolls increased by a median of 134 thousand in April 2025, a significant deceleration from the 228 thousand jobs added in March.
- The forecast aligns with the 130 thousand consensus and reflects a regression from the strong March print, which benefited from temporary factors like weather and strike resolution.
- Qualitative reports from staffing firms (ManpowerGroup, Robert Half) indicate a "wait-and-see" approach and hiring paralysis due to uncertainty surrounding tariffs and other policies.
- Leading indicators, such as the S&P Global Composite PMI, support this slowdown, falling to a 16-month low of 51.2 in April.
- The expected weakness stems from slowed hiring rather than mass job destruction, as weekly Initial Jobless Claims remained stable and historically low at approximately 222 thousand.
What will United States Non Farm Payrolls be for May 2025?
Actual Resolution: 19.00
Best RMSE: Trading Economics, Consensus
Mantic (mean)
147.7
Trading Economics
130.0TIE
Consensus
130.0TIE
RMSE
Mantic (mean)
16,554
Trading Economics
12,321
Consensus
12,321
View Mantic Prediction Analysis
- I forecast the May 2025 Non-Farm Payrolls change to be 154 thousand, with a 50% confidence interval spanning 116 thousand to 187 thousand.
- The forecast is positioned above the 125-130 thousand economist consensus, reflecting an expectation of persistent labor market resilience.
- Prediction markets assign a 40% probability to the 150-199 thousand range, which anchors the prediction despite expectations of a slowdown from April's 177 thousand job gains.
- The moderation from the April value acknowledges signals of softening demand, including the rise in initial jobless claims to 240 thousand for the week ending May 24.
- Corporate profit decline (Q1 2025, largest drop since 2020) and uncertainty over trade tariffs continue to disincentivize hiring, supporting the projected deceleration in job growth.
What will United States Non Farm Payrolls be for June 2025?
Actual Resolution: -13.00
Best RMSE: Trading Economics
Mantic (mean)
107.7
Trading Economics
100.0BEST
Consensus
110.0
RMSE
Mantic (mean)
14,568
Trading Economics
12,769
Consensus
15,129
View Mantic Prediction Analysis
- I forecast the June 2025 Non-Farm Payrolls to be 109 thousand, with an 80% confidence interval spanning from 21 thousand (10th percentile) to 226 thousand (90th percentile).
- The forecast is slightly below the prior month's reported gain of 139 thousand in May and aligns closely with the market consensus of 110 thousand.
- High-frequency data signals labor market softening; Initial Jobless Claims for the June survey week rose to 246 thousand, the highest level since August 2023.
- Restrictive immigration policies create a structural headwind, with Federal Reserve Chair Powell noting this is already slowing US labor force growth.
- Recent non-farm payroll reports have included significant net downward revisions, totaling 95 thousand for the March and April figures.
What will United States Non Farm Payrolls be for July 2025?
Actual Resolution: 72.00
Best RMSE: Trading Economics, Consensus
Mantic (mean)
130.6
Trading Economics
110.0TIE
Consensus
110.0TIE
RMSE
Mantic (mean)
3,428
Trading Economics
1,444
Consensus
1,444
View Mantic Prediction Analysis
- I predict United States Non-Farm Payrolls for July 2025 will be 133,000. My 50% confidence interval spans from 88,500 to 177,000.
- The June NFP report showed an increase of 147,000, indicating a continued slowdown from the 2024 monthly average of 168,000.
- The S&P Global Flash Services PMI surged to 55.2 in July, suggesting a rebound in service sector activity which is the economy’s largest employer.
- Downside risk is heavily signaled by the private sector; the June ADP report showed a loss of 33,000 jobs, and the ISM Services Employment Index was in contraction at 47.2%.
- The number of Initial Jobless Claims remains low at 217,000 for the week ending July 19, which suggests layoffs are not increasing significantly despite hiring headwinds.
What will United States Non Farm Payrolls be for August 2025?
Actual Resolution: -4.00
Best RMSE: Trading Economics, Consensus
Mantic (mean)
78.05
Trading Economics
75.00TIE
Consensus
75.00TIE
RMSE
Mantic (mean)
6,733
Trading Economics
6,241
Consensus
6,241
View Mantic Prediction Analysis
- I forecast the August 2025 Non-Farm Payrolls (NFP) at 71 thousand, with a 50% confidence interval spanning 33 thousand to 111 thousand.
- The US labor market is showing significant cooling. The July NFP was 73 thousand, and the 3-month average job gain fell to approximately 35 thousand following massive downward revisions to May and June prints.
- Supporting indicators for labor market softness include continuing jobless claims, which reached their highest level since November 2021 (1.972 million for the week ending August 9).
- The forecast median aligns closely with the market consensus of 75-78 thousand, reflecting the expectation of continued sub-100k job growth.
- Robust non-labor data introduces significant upside uncertainty: the August S&P Global Composite PMI rose to 55.4, indicating accelerating business activity and stronger hiring in the services sector.
What will United States Non Farm Payrolls be for September 2025?
Actual Resolution: 119.0
Best RMSE: Trading Economics, Consensus
Mantic (mean)
31.26
Trading Economics
50.00TIE
Consensus
50.00TIE
RMSE
Mantic (mean)
7,698
Trading Economics
4,761
Consensus
4,761
View Mantic Prediction Analysis
- The median forecast for the September 2025 Non-Farm Payrolls gain is 28.1 thousand jobs with a mode of 32.0 thousand.
- The 80% confidence interval for the job change spans a loss of 66.0 thousand to a gain of 137.0 thousand, reflecting high uncertainty due to the delayed official report.
- The ADP National Employment Report signaled a loss of 32 thousand private-sector jobs for September, contrasting sharply with the pre-shutdown consensus forecast of 50 thousand.
- The labor market is approaching a critical juncture, as the 3-month average NFP gain through August was only 29 thousand, indicating job growth is near the estimated breakeven level.
- Resilient indicators, such as 16.8% year-over-year revenue growth for payroll processor Paychex (PAYX), suggest underlying strength in the small business labor market which may offset broader sectoral weakness.
What will United States PCE Price Index Annual Change be for January 2025?
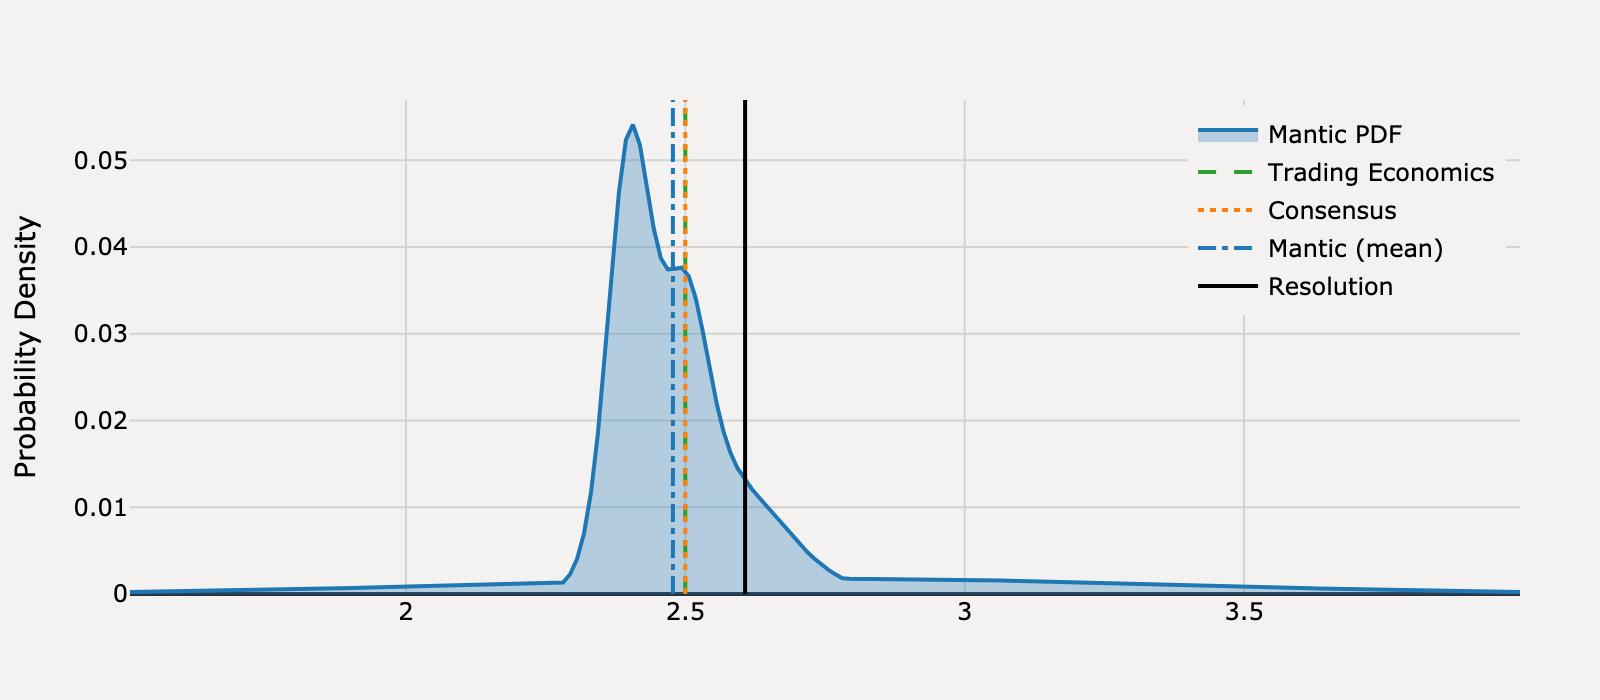
Actual Resolution: 2.61
Best RMSE: Trading Economics, Consensus
Mantic (mean)
2.48
Trading Economics
2.50TIE
Consensus
2.50TIE
RMSE
Mantic (mean)
0.017
Trading Economics
0.011
Consensus
0.011
View Mantic Prediction Analysis
- I forecast the United States PCE Price Index Annual Change for January 2025 to be 2.47%. The 50% confidence interval spans 2.4% to 2.57%.
- Federal Reserve Governor Adriana Kugler stated on February 20, 2025, that the PCE index is expected to show a 2.4% increase. This official guidance anchors the lower end of the forecast.
- The year-over-year rate is mathematically pressured downward by a high base effect from January 2024 falling out of the 12-month calculation. The December 2024 rate was 2.6%.
- Moderation is expected despite "hot" January CPI (3.0%) and PPI (3.5%) data. This is due to the PCE's heavy weighting on soft components like healthcare services, which saw prices drop by -0.5%.
What will United States PCE Price Index Annual Change be for February 2025?
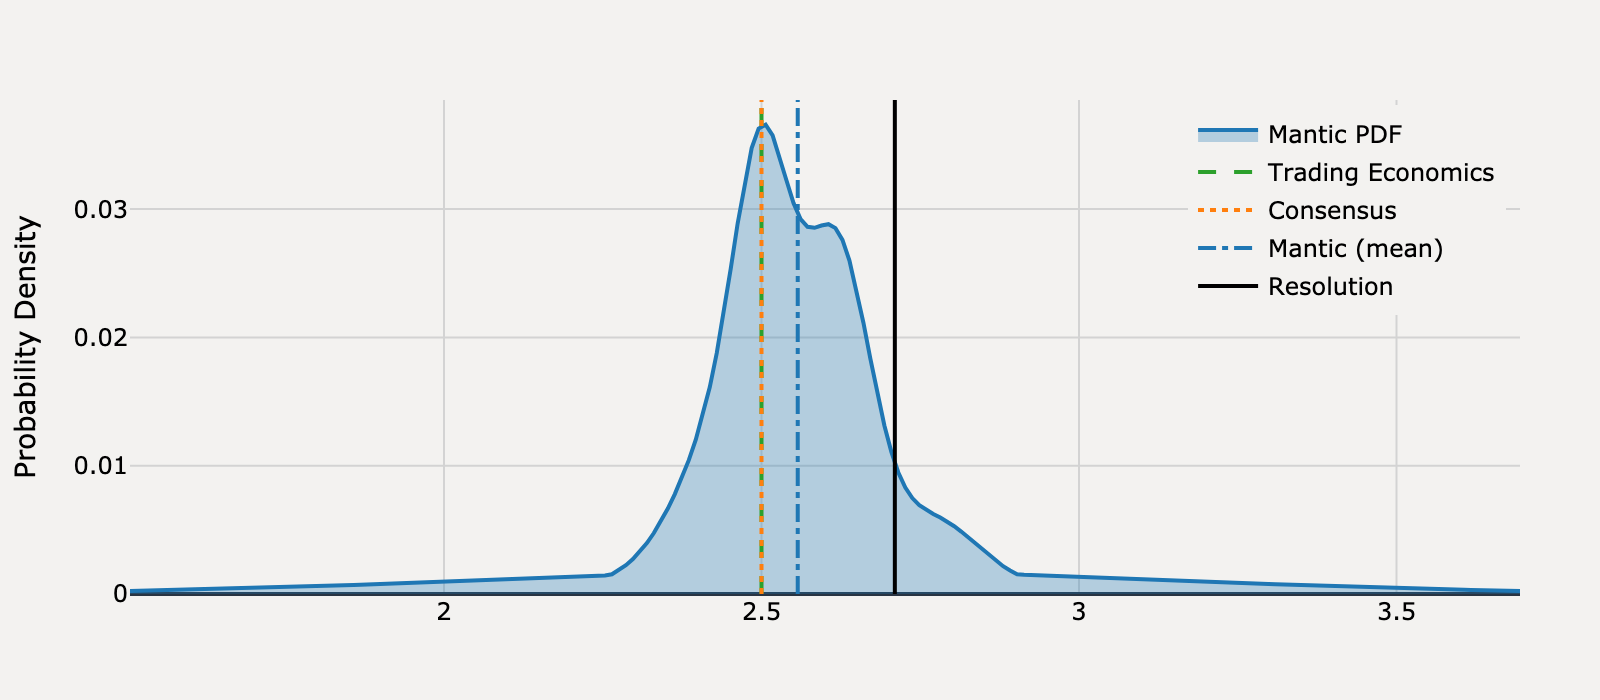
Actual Resolution: 2.71
Best RMSE: Mantic
Mantic (mean)
2.56BEST
Trading Economics
2.50
Consensus
2.50
RMSE
Mantic (mean)
0.023
Trading Economics
0.044
Consensus
0.044
View Mantic Prediction Analysis
- The median forecast for the United States PCE Price Index Annual Change in February 2025 is 2.55%, with a 50% confidence interval spanning 2.46% to 2.65%.
- The forecast is anchored by the last official reading of 2.5% for January 2025 and the market consensus of 2.5% for February 2025, according to the Trading Economics calendar.
- The Core PCE (excluding food and energy) consensus forecast for February 2025 is 2.7%, indicating persistent underlying inflation expected to be driven by sticky components like hospital care and insurance.
- The Federal Reserve recently revised its 2025 year-end PCE projection upward to 2.7%, signaling higher inflation expectations and a risk of the February print exceeding the 2.5% baseline.
- The February CPI reading of 2.8% supports a PCE value in the 2.4% to 2.6% range, as the PCE index typically runs 0.2 to 0.4 percentage points lower than CPI due to differing weights and methodologies.
What will United States PCE Price Index Annual Change be for March 2025?
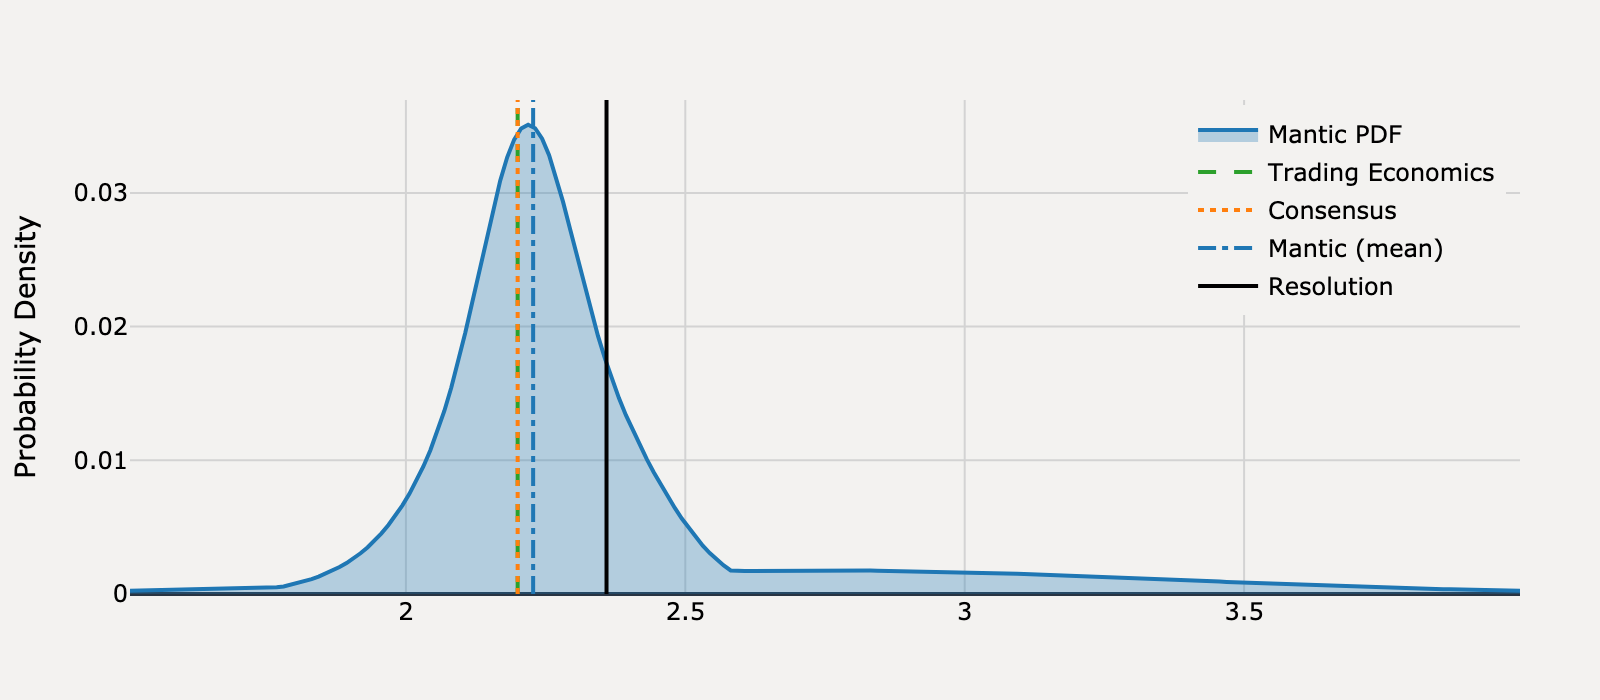
Actual Resolution: 2.36
Best RMSE: Mantic
Mantic (mean)
2.23BEST
Trading Economics
2.20
Consensus
2.20
RMSE
Mantic (mean)
0.017
Trading Economics
0.025
Consensus
0.025
View Mantic Prediction Analysis
- I forecast the United States PCE Price Index Annual Change for March 2025 to be 2.25%.
- The 50% confidence interval for the annual change spans from 2.15% to 2.38%.
- The forecast is anchored to the 2.2% market consensus and mechanically supported by favorable base effects from March 2024.
- The March 2025 Headline Consumer Price Index (CPI) of 2.4% suggests a PCE value in the 2.0% to 2.2% range, as PCE typically runs lower than CPI.
- Downward pressure on the headline figure is confirmed by the deflationary U.S. Producer Price Index (PPI), which dropped 0.4% month-over-month in March, indicating easing goods prices.
What will United States PCE Price Index Annual Change be for April 2025?
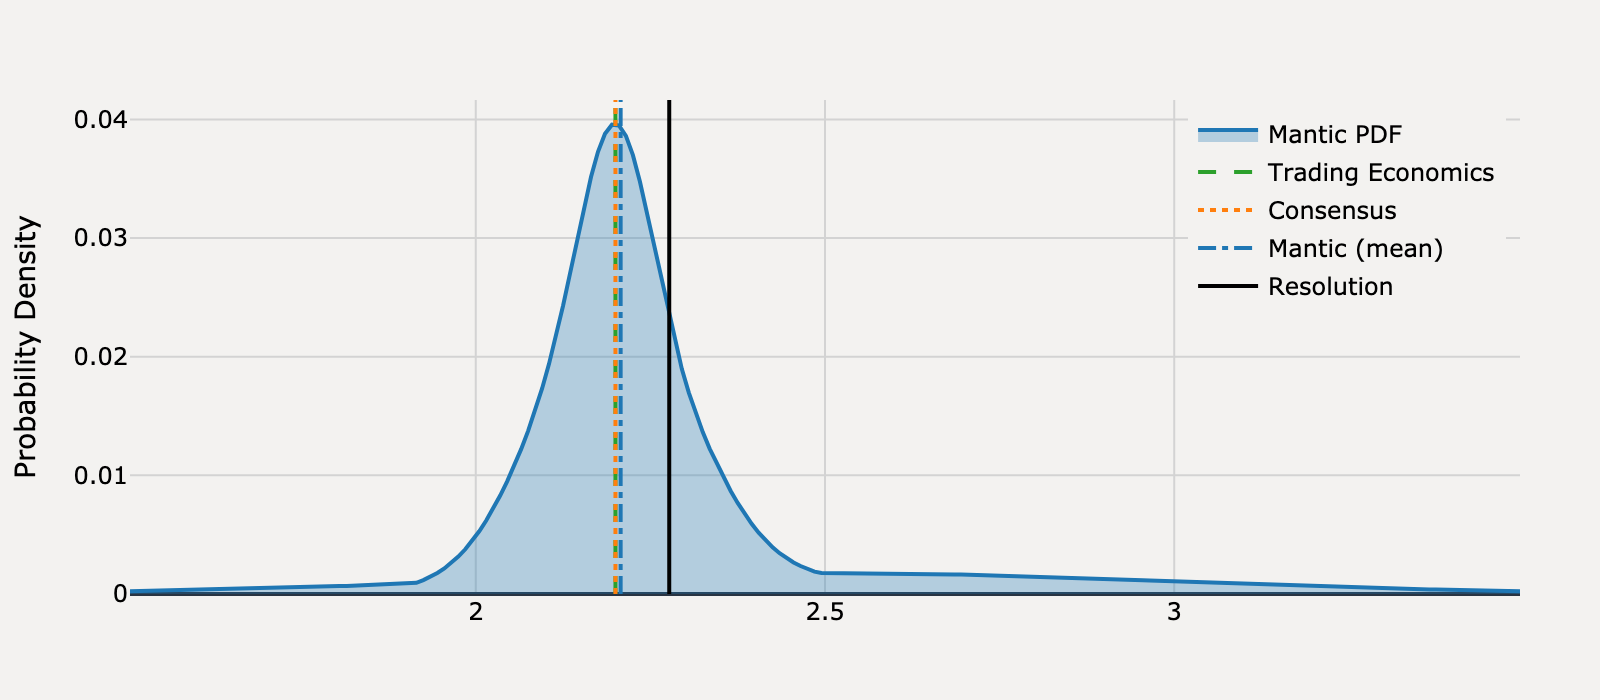
Actual Resolution: 2.28
Best RMSE: Mantic
Mantic (mean)
2.21BEST
Trading Economics
2.20
Consensus
2.20
RMSE
Mantic (mean)
0.005
Trading Economics
0.006
Consensus
0.006
View Mantic Prediction Analysis
- I forecast the United States PCE Price Index Annual Change for April 2025 to be 2.21%, with a 50% confidence interval ranging narrowly from 2.14% to 2.30%.
- This prediction reflects a slight moderation from the March 2025 reading of 2.29%, aligning closely with the Trading Economics consensus forecast of 2.2%.
- The forecast is supported by two deflationary factors: the PCE index's lower weighting on sticky shelter costs compared to CPI, and documented declines in energy prices during April (Yahoo price data).
- Upside risk is present due to expected tariff policies, which have led analysts like Goldman Sachs and NABE to forecast 2025 Core PCE inflation accelerating toward 3.5%.
- The year-over-year rate has been highly stable, ranging only between 2.10% and 2.72% over the 12 months preceding April 2025 (BEA data).
What will United States PCE Price Index Annual Change be for May 2025?

Actual Resolution: 2.46
Best RMSE: Consensus
Mantic (mean)
2.29
Trading Economics
2.20
Consensus
2.30BEST
RMSE
Mantic (mean)
0.029
Trading Economics
0.067
Consensus
0.025
View Mantic Prediction Analysis
- I forecast the United States PCE Price Index Annual Change for May 2025 will be 2.29%, with an interquartile range from 2.20% to 2.39%.
- The last reported PCE annual change was 2.13% in April 2025, based on U.S. Bureau of Economic Analysis (BEA) data.
- Upward pressure results from base effects from unusually low inflation in May 2024 and the fact that the May Consumer Price Index (CPI) printed 2.4%.
- The forecast is moderated by a 3% monthly decline in gasoline prices and weak signals from May Producer Price Index (PPI) components that feed directly into PCE, such as airfares and healthcare.
- The Federal Reserve recently revised its year-end core PCE inflation projection upward to 3.1%, signaling a structural expectation of sticky inflation well above the 2% target.
What will United States PCE Price Index Annual Change be for June 2025?
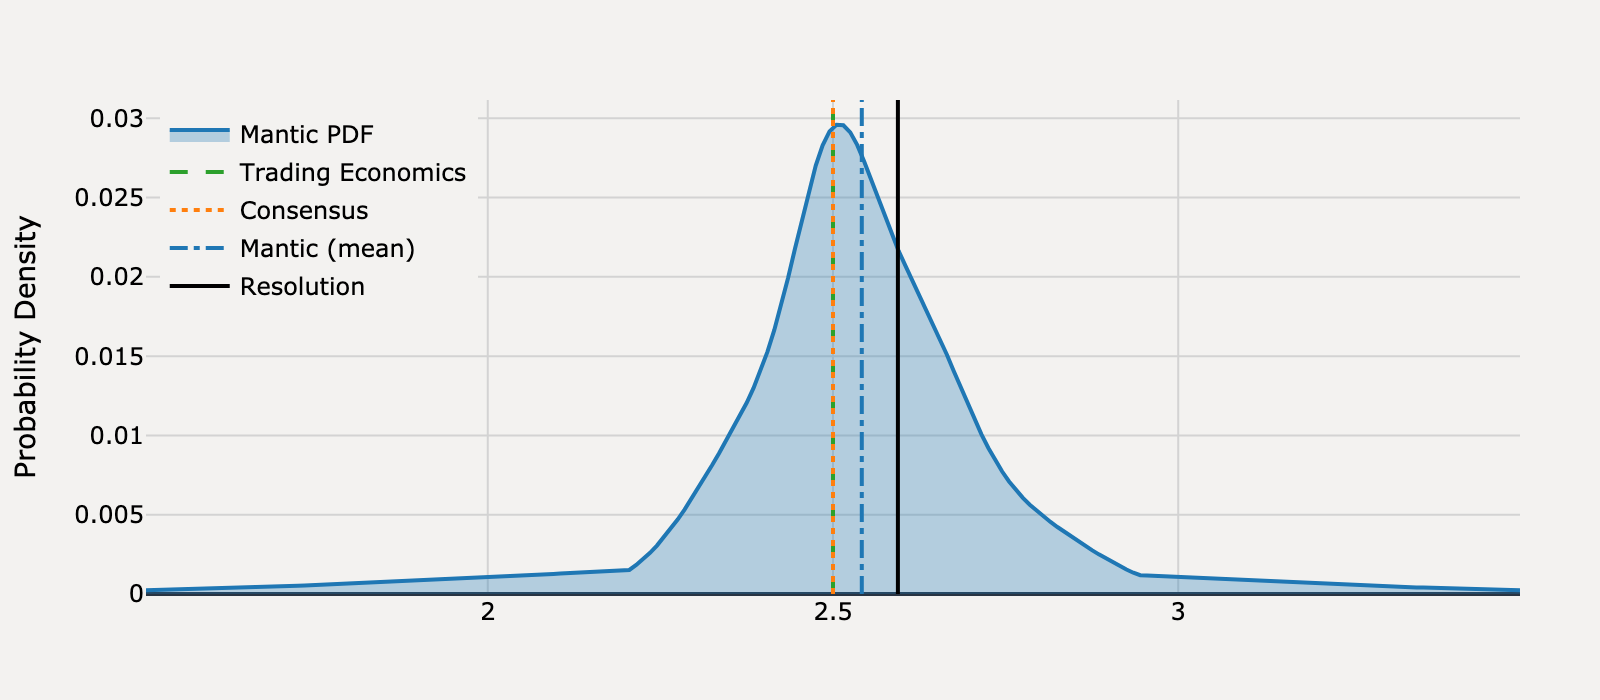
Actual Resolution: 2.59
Best RMSE: Mantic
Mantic (mean)
2.54BEST
Trading Economics
2.50
Consensus
2.50
RMSE
Mantic (mean)
0.003
Trading Economics
0.009
Consensus
0.009
View Mantic Prediction Analysis
- I forecast the United States PCE Price Index Annual Change for June 2025 will be 2.53%.
- The 50% confidence interval for the forecast spans 2.43% to 2.64%.
- The most recent official reading for the PCE Price Index Annual Change was 2.34% in May 2025.
- Inflationary pressure accelerated in June, demonstrated by the Consumer Price Index (CPI) rising to 2.7% YoY.
- This acceleration is linked to tariff pass-through on goods, a factor the Federal Reserve previously warned would appear in June data.
- Although PCE typically tracks below CPI, the goods-centric nature of this inflation suggests the PCE may rise faster than usual, narrowing the spread with the CPI (2.7% for June).
What will United States PCE Price Index Annual Change be for July 2025?
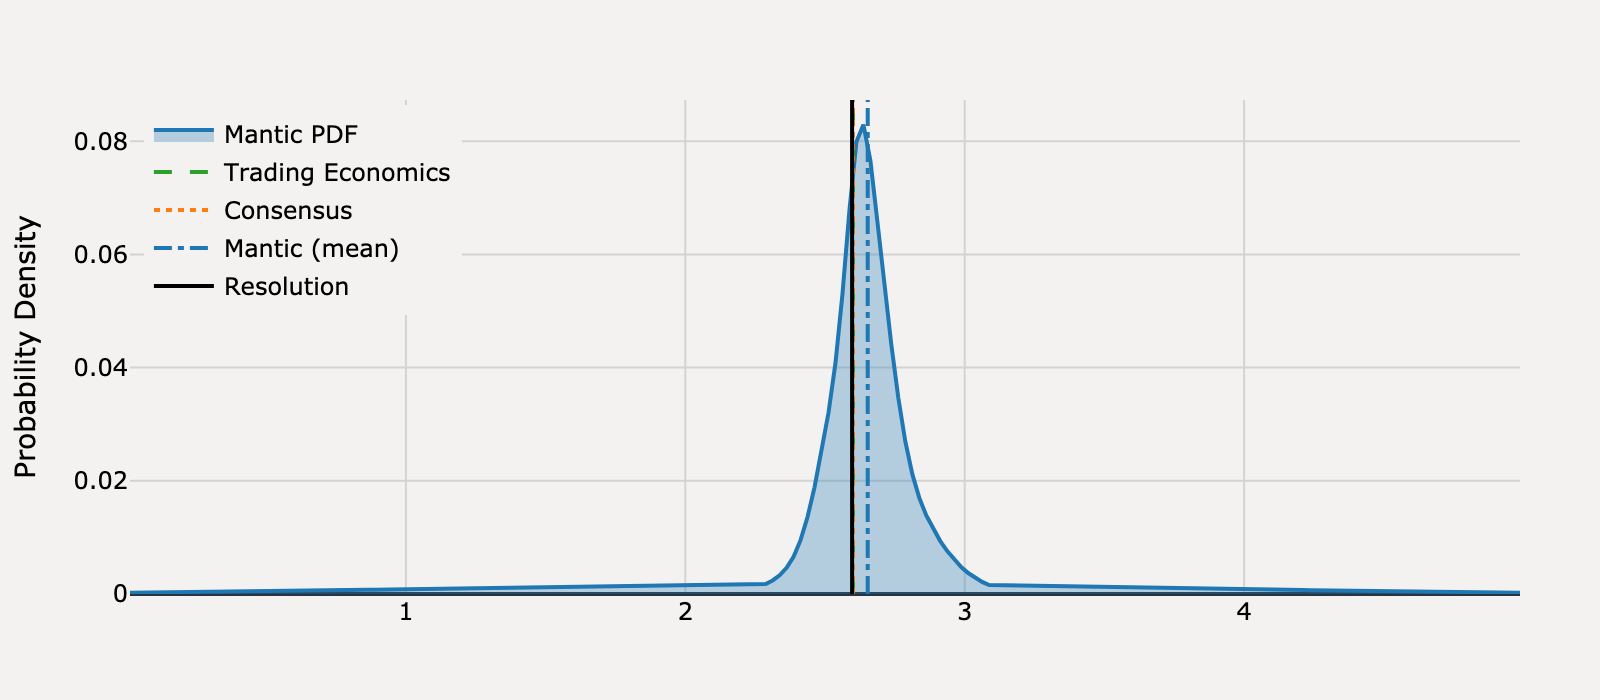
Actual Resolution: 2.60
Best RMSE: Trading Economics, Consensus
Mantic (mean)
2.65
Trading Economics
2.60TIE
Consensus
2.60TIE
RMSE
Mantic (mean)
0.003
Trading Economics
0
Consensus
0
View Mantic Prediction Analysis
- I forecast the United States PCE Price Index Annual Change for July 2025 will be 2.64%, with a 50% confidence interval spanning 2.54% to 2.74%.
- The forecast is anchored near the market consensus of 2.6% for July, following the official June 2025 reading of 2.6%.
- Upward pressure on prices is evident from the July Producer Price Index (PPI) which surged 0.9% month-over-month, signaling rising input costs for businesses.
- Accelerating goods inflation driven by increasing tariffs on imported goods presents an ongoing upward risk to the headline PCE reading.
- Countervailing disinflationary pressure is provided by the labor market, which continues to soften, with the unemployment rate rising to 4.2% in July.
What will United States PCE Price Index Annual Change be for August 2025?
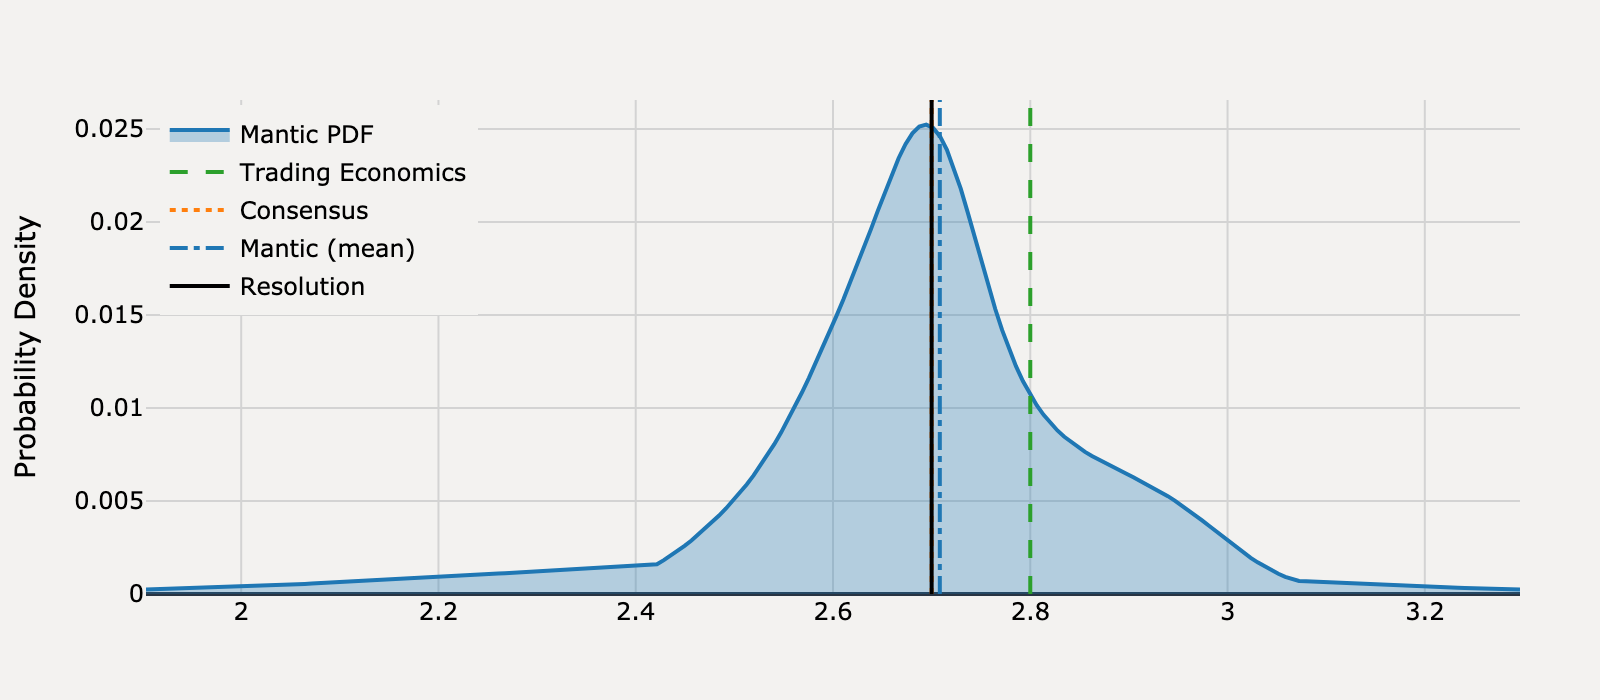
Actual Resolution: 2.70
Best RMSE: Mantic, Consensus
Mantic (mean)
2.71TIE
Trading Economics
2.80
Consensus
2.70TIE
RMSE
Mantic (mean)
0
Trading Economics
0.01
Consensus
0
View Mantic Prediction Analysis
- I forecast the United States PCE Price Index Annual Change for August 2025 to be 2.69%, with a 50% confidence interval between 2.60% and 2.79%.
- This prediction is anchored by the 2.7% market consensus and is slightly above the 2.6% official reading reported for July 2025.
- Disinflationary pressure on the headline number comes from the energy component, evidenced by a 0.4% decline in final demand energy in the August Producer Price Index (PPI) and a 0.8% drop in import fuel prices.
- The primary source of upside risk is persistent underlying price pressure, as the consensus forecast for the Core PCE Price Index remains sticky at 2.9% for August.
- The Federal Reserve's September Summary of Economic Projections (SEP) reinforces this sticky inflation outlook, maintaining the forecast for 2025 PCE inflation at 3.0%.
What will United States PCE Price Index Annual Change be for September 2025?
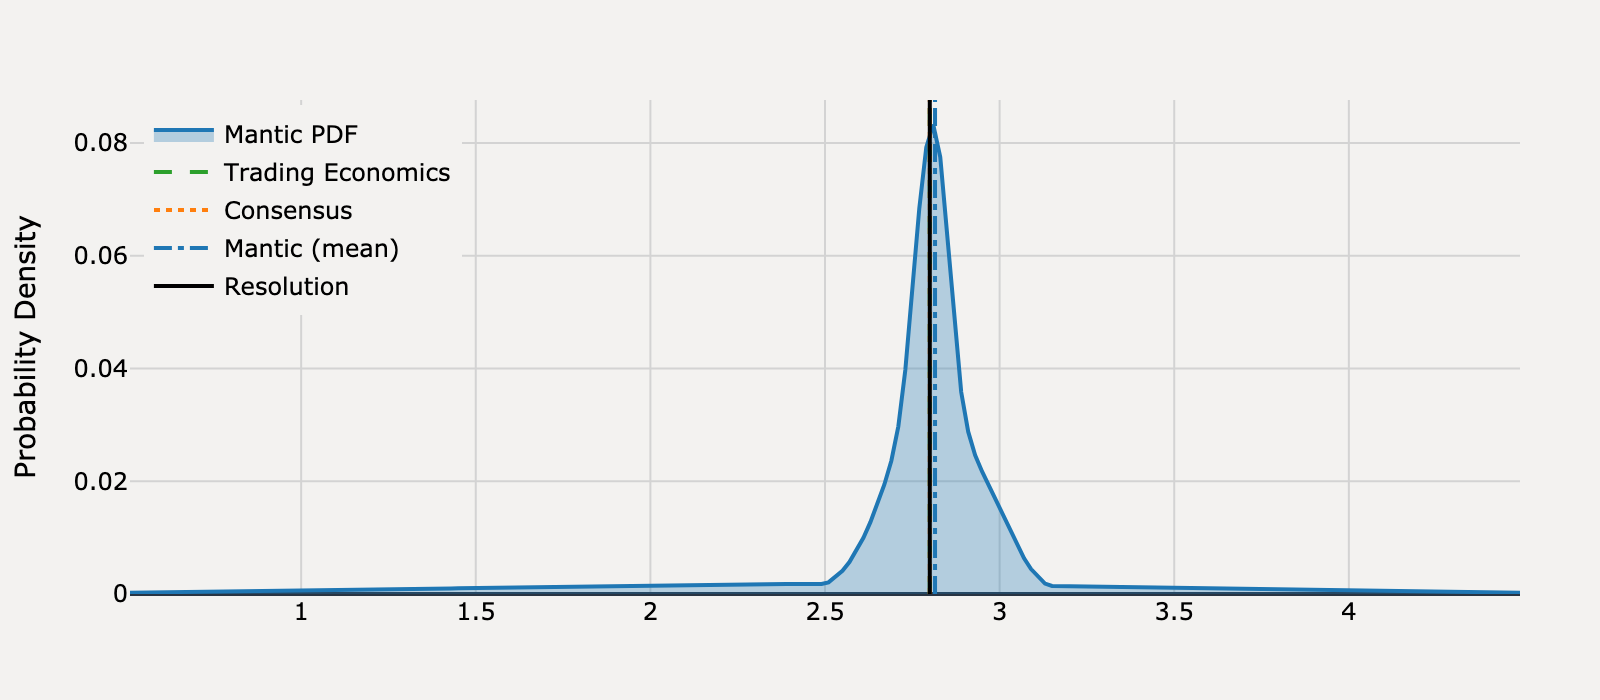
Actual Resolution: 2.80
Best RMSE: Mantic, Trading Economics, Consensus
Mantic (mean)
2.82TIE
Trading Economics
2.80TIE
Consensus
2.80TIE
RMSE
Mantic (mean)
0
Trading Economics
0
Consensus
0
View Mantic Prediction Analysis
- I forecast the US PCE Price Index Annual Change for September 2025 will be 2.8%. My 80% confidence interval is tightly centered, spanning from 2.2% to 3.04%.
- The 2.8% forecast aligns precisely with the market consensus for the September PCE Annual Change reported in the Trading Economics calendar data.
- The predicted annual rate is mechanically derived from projecting a 0.3% month-over-month (MoM) increase for the September PCE index.
- This MoM increase is supported by a 0.3% MoM rise in the September Producer Price Index (PPI) and a sharp increase in energy prices.
- The Core PCE Annual Change consensus forecast is 2.9% for September 2025, confirming that underlying inflation remains persistent near 3.0%.
What will United States Producer Prices be for January 2025?
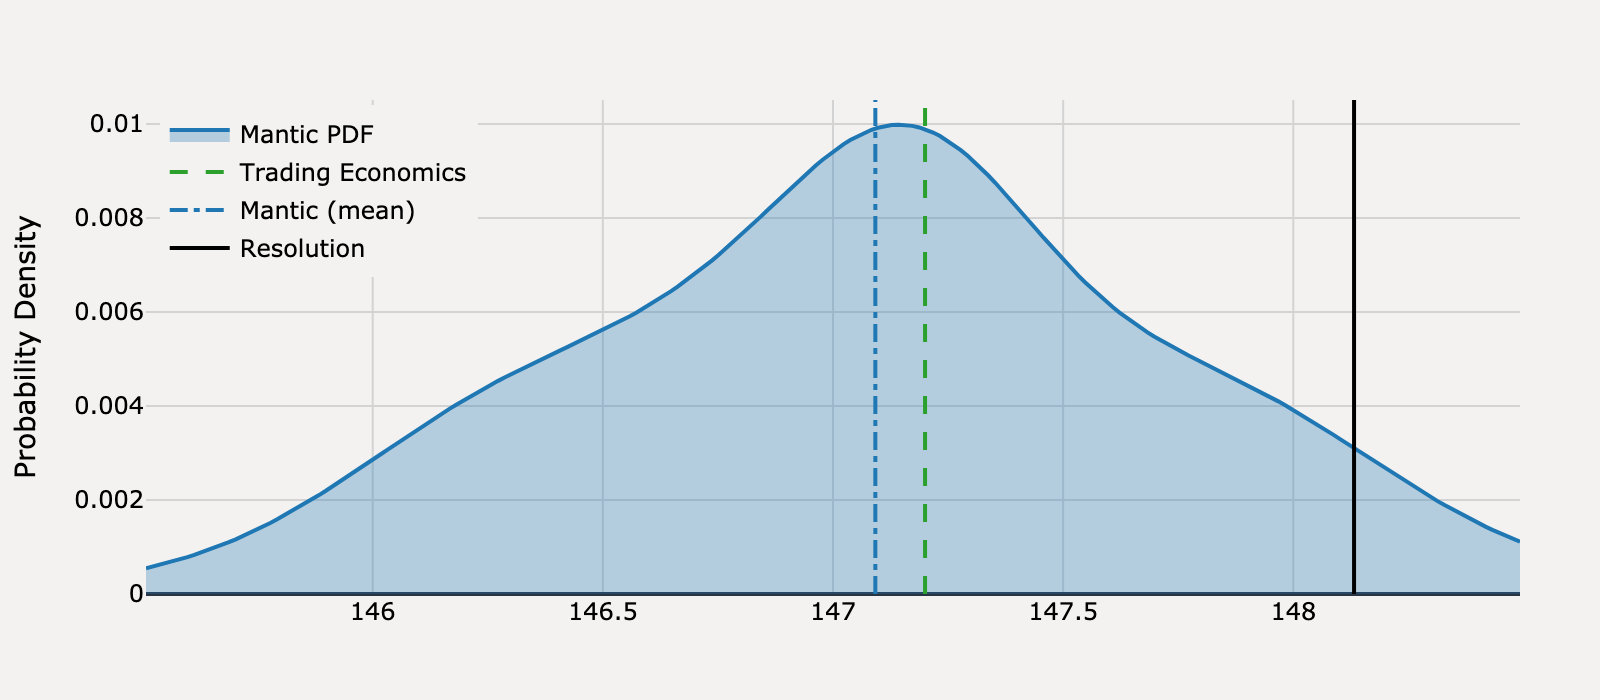
Actual Resolution: 148.1
Best RMSE: Trading Economics
Mantic (mean)
147.1
Trading Economics
147.2BEST
Consensus
-
RMSE
Mantic (mean)
1.08
Trading Economics
0.869
View Mantic Prediction Analysis
- I forecast the United States Producer Prices (PPI) for January 2025 will be approximately 147.1 points.
- The forecast is anchored on the PPI Final Demand index, estimated at 146.5 points in December 2024 after applying historical growth rates.
- Leading indicators point to upward pressure; the ISM Manufacturing Prices Index rose to 54.9 in January, marking its fourth straight month of price increases.
- The ISM Services Prices Index remained high at 60.4 in January, indicating persistent price acceleration in the services component of the supply chain.
- January typically sees a positive month-over-month increase due to the annual reset of contract prices, which is known as the "January effect."
What will United States Producer Prices be for February 2025?
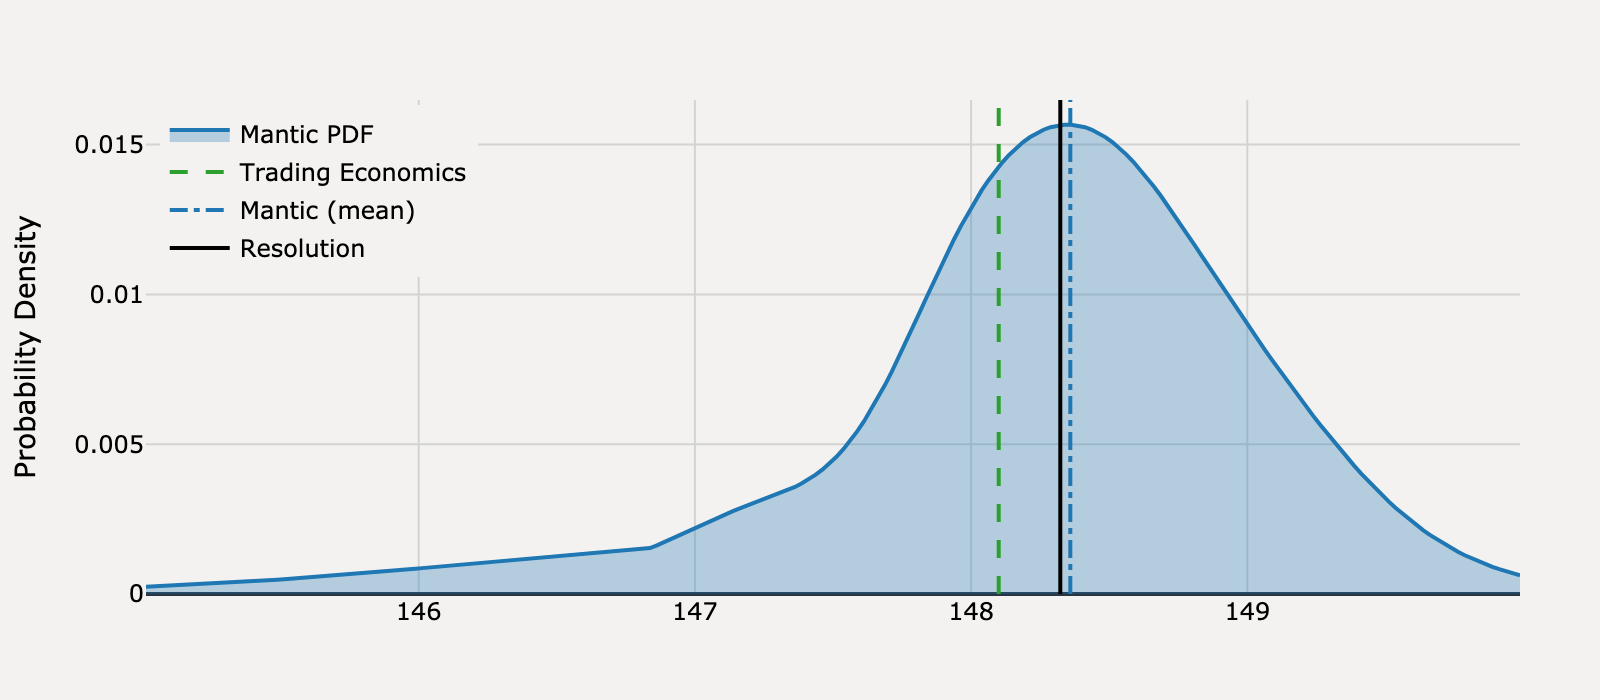
Actual Resolution: 148.3
Best RMSE: Mantic
Mantic (mean)
148.4BEST
Trading Economics
148.1
Consensus
-
RMSE
Mantic (mean)
0.001
Trading Economics
0.05
View Mantic Prediction Analysis
- I forecast United States Producer Prices for February 2025 to be centered between 148.0 and 149.0 points, with a primary estimate of 148.5 points.
- The forecast is anchored on an estimated January 2025 PPI level of approximately 147.7 points, derived from applying the reported 3.5% year-on-year increase to the January 2024 index value (142.713).
- Leading indicators signal strong inflationary pressure, with the ISM Manufacturing Prices Paid Index surging to 62.4 and the Services Prices Paid Index reaching 62.6 in February 2025.
- The sharp rise in ISM indices is largely attributed to anticipatory pricing and dramatic increases in commodity costs due to new and potential tariffs.
- The overall month-over-month price increase is partially offset by a significant deflationary signal from energy inputs, as the United States Oil Fund (USO) recorded an 8.2% loss over the month.
What will United States Producer Prices be for March 2025?
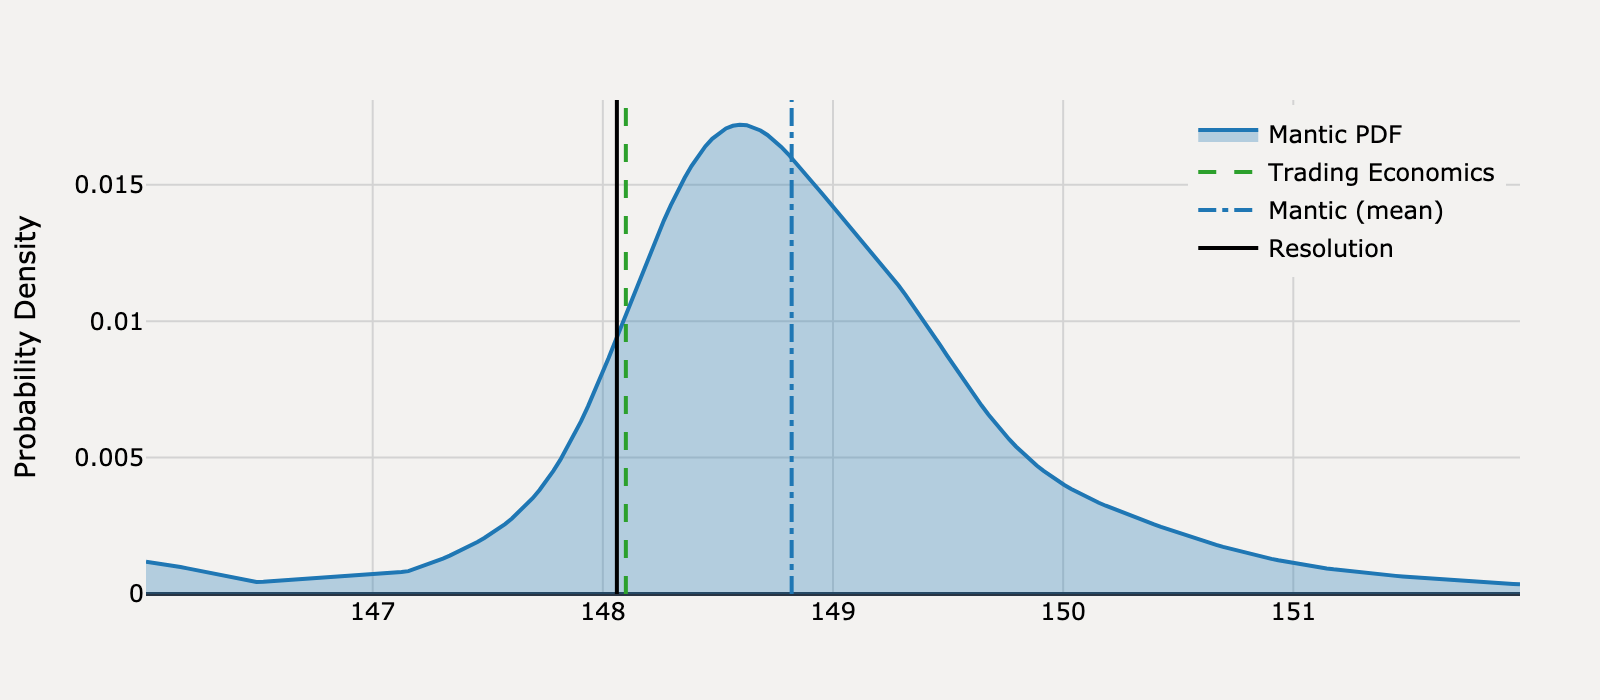
Actual Resolution: 148.1
Best RMSE: Trading Economics
Mantic (mean)
148.8
Trading Economics
148.1BEST
Consensus
-
RMSE
Mantic (mean)
0.577
Trading Economics
0.002
View Mantic Prediction Analysis
- I forecast the United States Producer Prices for March 2025 will be 149.0 points, with an 80% confidence interval spanning 148.0 to 150.0 points.
- The prediction reflects a significant month-over-month acceleration in price growth, following the unexpectedly unchanged reading in February 2025.
- The primary inflationary mechanism is surging material costs, as the ISM Manufacturing Prices Index jumped to 69.4 in March, its highest level since June 2022.
- This cost acceleration is attributed to the immediate impact of new tariffs, driving dramatic price increases for steel and aluminum.
- Persistent inflation in the services sector continues to exert upward pressure, with the ISM Services Prices Index registering an elevated 60.9 percent in March.
What will United States Producer Prices be for April 2025?
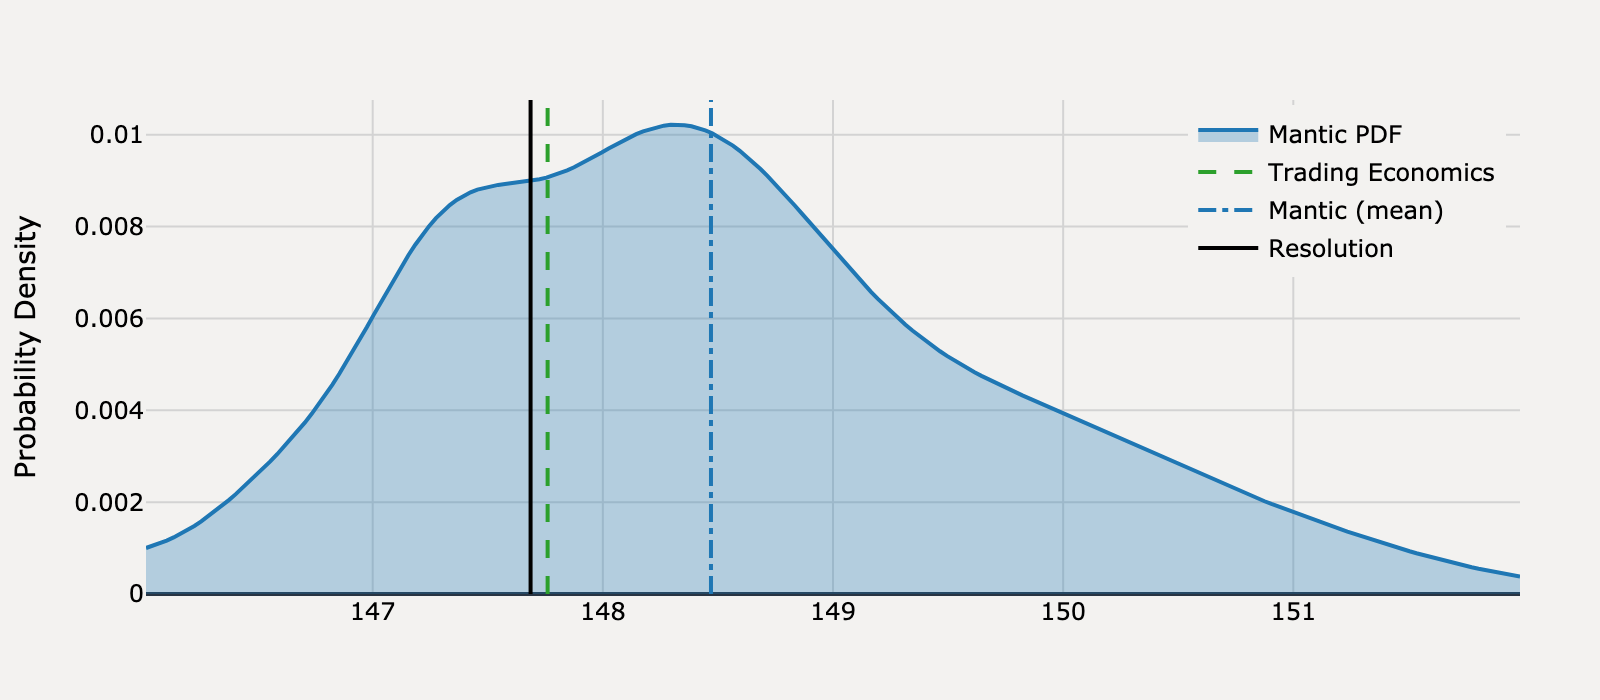
Actual Resolution: 147.7
Best RMSE: Trading Economics
Mantic (mean)
148.5
Trading Economics
147.8BEST
Consensus
-
RMSE
Mantic (mean)
0.614
Trading Economics
0.005
View Mantic Prediction Analysis
- I estimate the United States Producer Prices index for April 2025 will be 148.3 points, with a 50% confidence interval spanning 148.0 to 149.0 points.
- The primary inflationary driver is the immediate effect of new trade tariffs, which industry analysts expected to be visible in April data due to the 10% levy on most imports.
- This upward pressure is supported by the ISM Manufacturing Prices Index for April 2025, which surged to 69.8%, the highest level since June 2022, indicating widespread producer input cost increases.
- The forecast is constrained by significant deflationary pressure from the energy sector. Crude oil prices hit a period low of approximately $55 per barrel in April 2025.
- The April value represents a rebound from the estimated March 2025 PPI of 147.4 points, which had been previously dampened by falling energy prices.
What will United States Producer Prices be for May 2025?
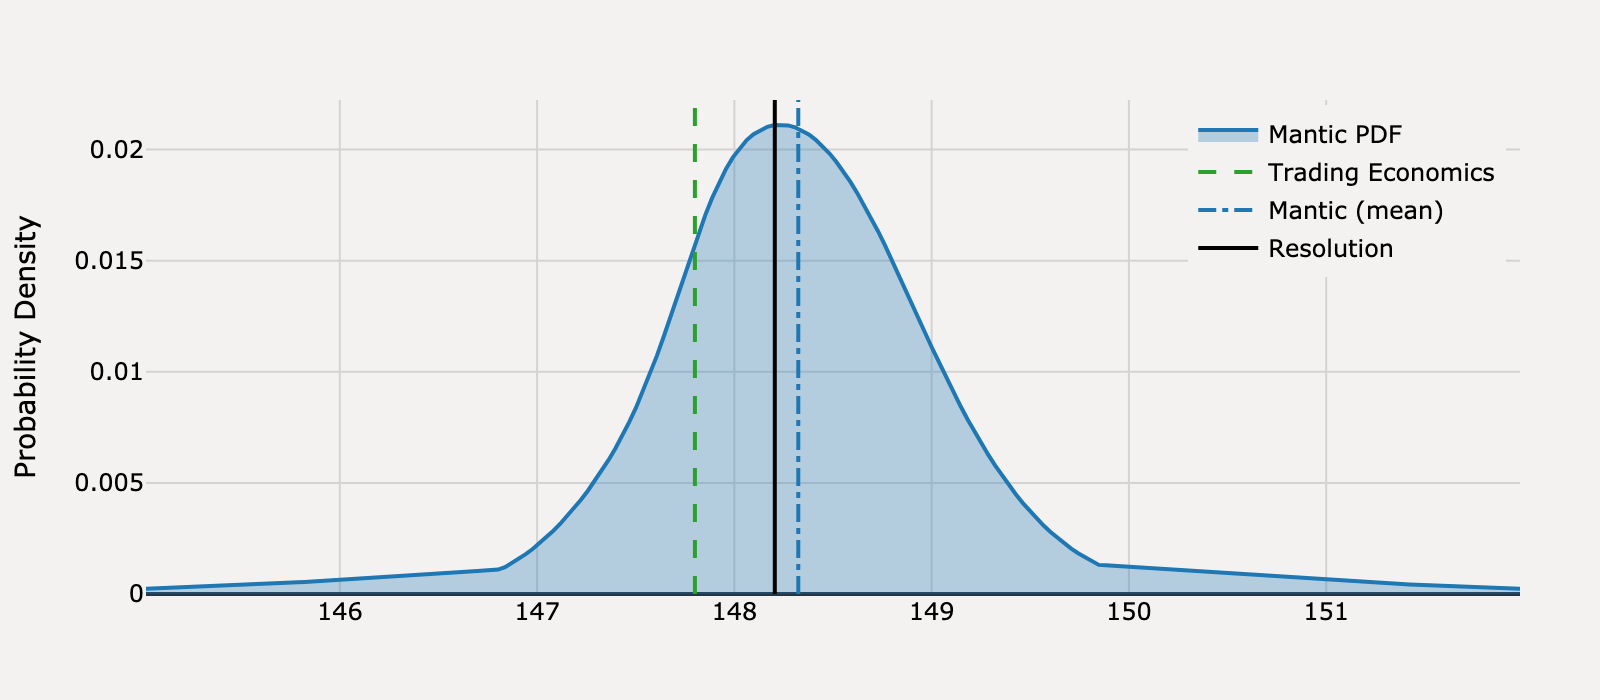
Actual Resolution: 148.2
Best RMSE: Mantic
Mantic (mean)
148.3BEST
Trading Economics
147.8
Consensus
-
RMSE
Mantic (mean)
0.014
Trading Economics
0.164
View Mantic Prediction Analysis
- I forecast the United States Producer Price Index for May 2025 to be 148 points, with an 80% confidence interval spanning 147 to 149 points.
- The forecast assumes a strong rebound from the unexpected 0.5% month-over-month decline reported for April 2025, which established an approximate baseline of 147.7 points.
- Leading indicators for May signal sharp upward pressure on prices, driven by businesses passing on newly instituted tariff-related input costs.
- The S&P Global Prices Charged index, a proxy for output prices, surged to 59.3 in May, reaching its highest level since August 2022.
- This inflationary acceleration is reinforced by the ISM Services Prices Paid index, which rose to 68.7 in May, signaling acute input cost pressure on producers.
What will United States Producer Prices be for June 2025?
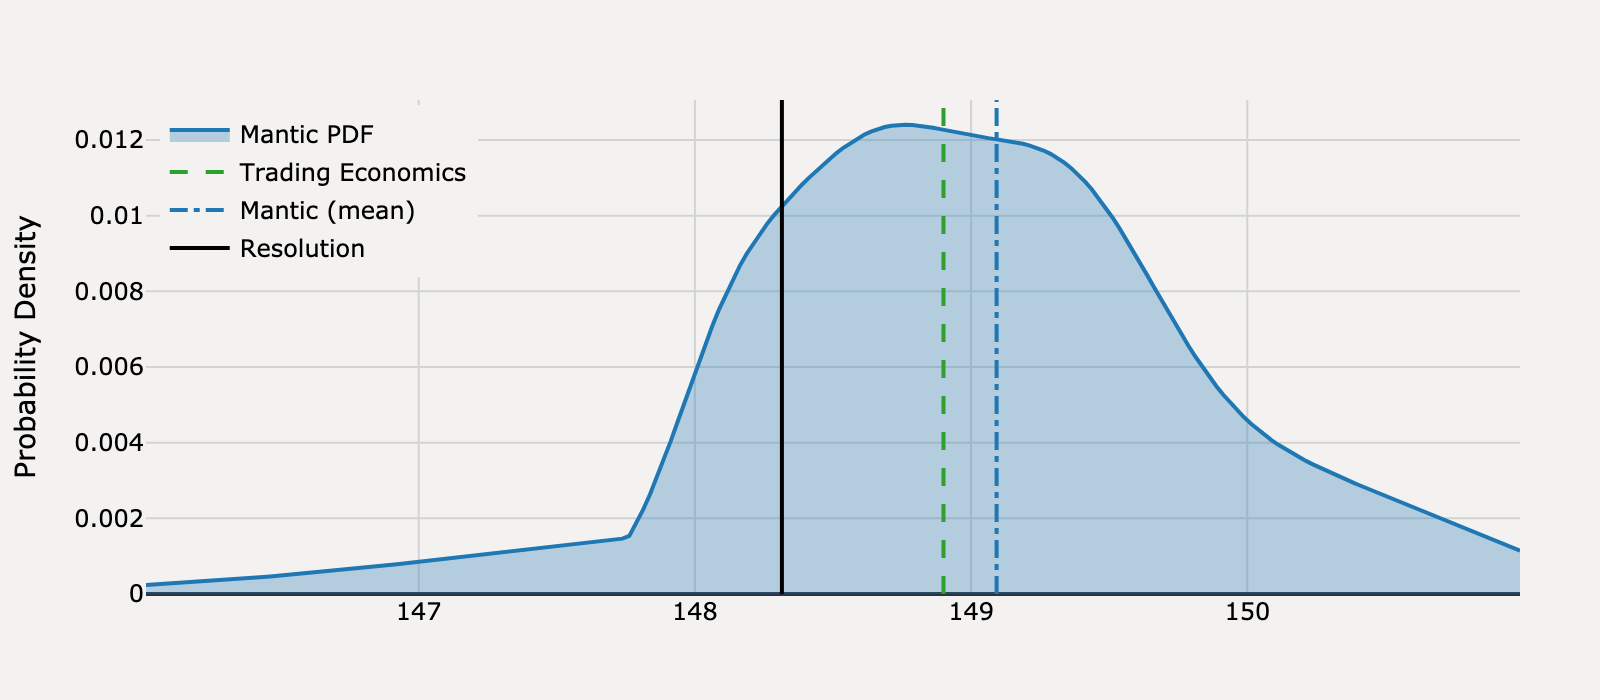
Actual Resolution: 148.3
Best RMSE: Trading Economics
Mantic (mean)
149.1
Trading Economics
148.9BEST
Consensus
-
RMSE
Mantic (mean)
0.604
Trading Economics
0.342
View Mantic Prediction Analysis
- I forecast the US Producer Price Index for June 2025 to be 149.0 points. My 50% confidence interval is 148.0 to 150.0 points.
- The forecast implies a strong acceleration in producer prices following the "tame" 0.1% monthly rise reported for May 2025.
- The primary driver is intense cost-push inflation signaled by the ISM Manufacturing Prices Index, which hit 69.7% in June, its highest level since mid-2022.
- This high reading is attributed to manufacturers passing on the costs of aggressive tariffs and rising commodity prices, including steel, aluminum, and energy inputs.
- The May 2025 PPI baseline is estimated at 148.0 points, based on the reported 2.6% year-over-year advance through May.
What will United States Producer Prices be for July 2025?
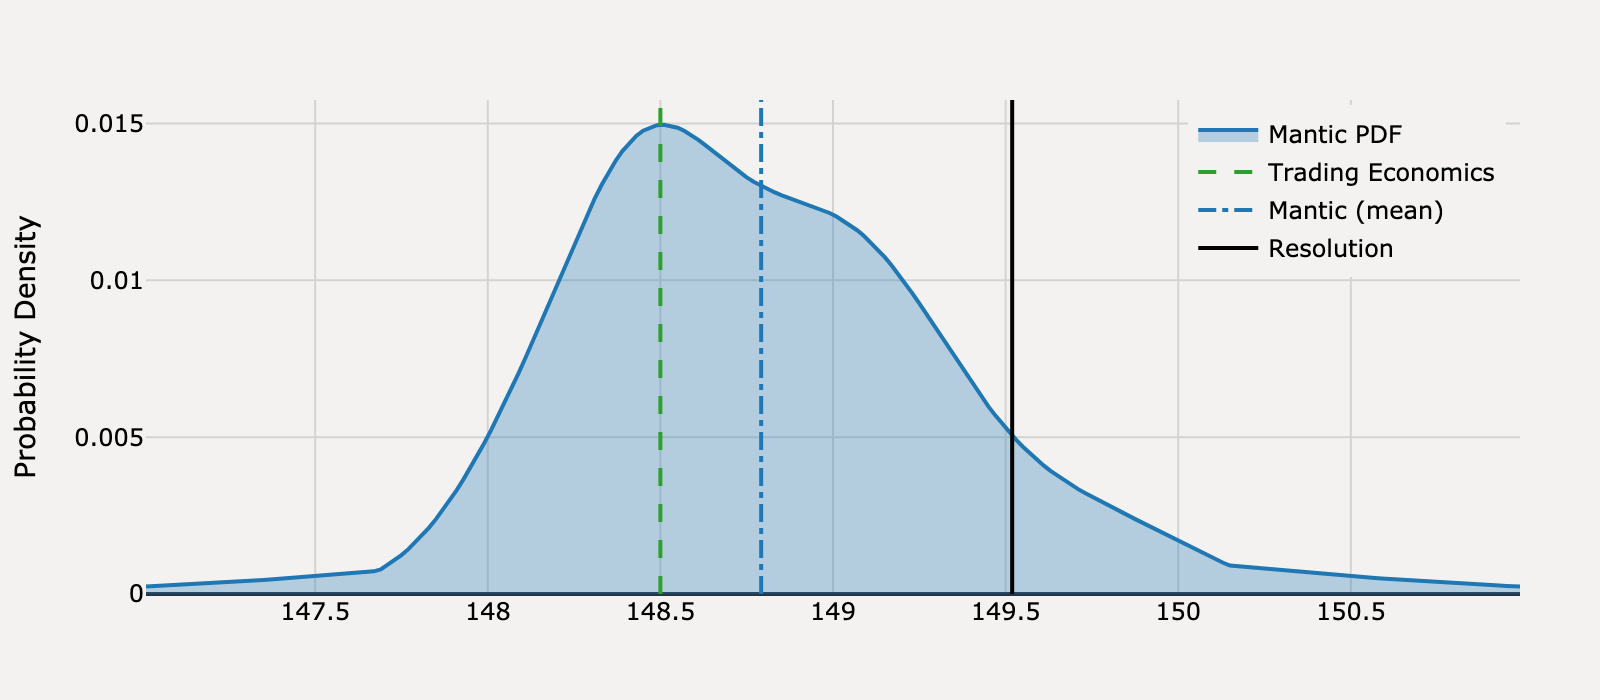
Actual Resolution: 149.5
Best RMSE: Mantic
Mantic (mean)
148.8BEST
Trading Economics
148.5
Consensus
-
RMSE
Mantic (mean)
0.529
Trading Economics
1.04
View Mantic Prediction Analysis
- I forecast the United States Producer Prices for July 2025 will be 149 points.
- The forecast is anchored to an estimated June 2025 PPI value of 148.16, following a flat 0.0% month-over-month change in June (MSN, SocialBizWire).
- Inflationary pressure is expected to re-accelerate sharply in July due to the services sector; the ISM Services Prices Index rose to 69.9 percent, its highest reading since October 2022 (MENAFN).
- Cost-push factors from tariffs are driving prices higher, with the S&P Global measure of prices charged by businesses rising at one of the largest rates in three years (Yahoo).
- This anticipated inflation from costs is expected to outweigh counter-signals of weakening demand, such as the continued contraction in the Manufacturing PMI at 48.0 (MENAFN).
What will United States Producer Prices be for August 2025?
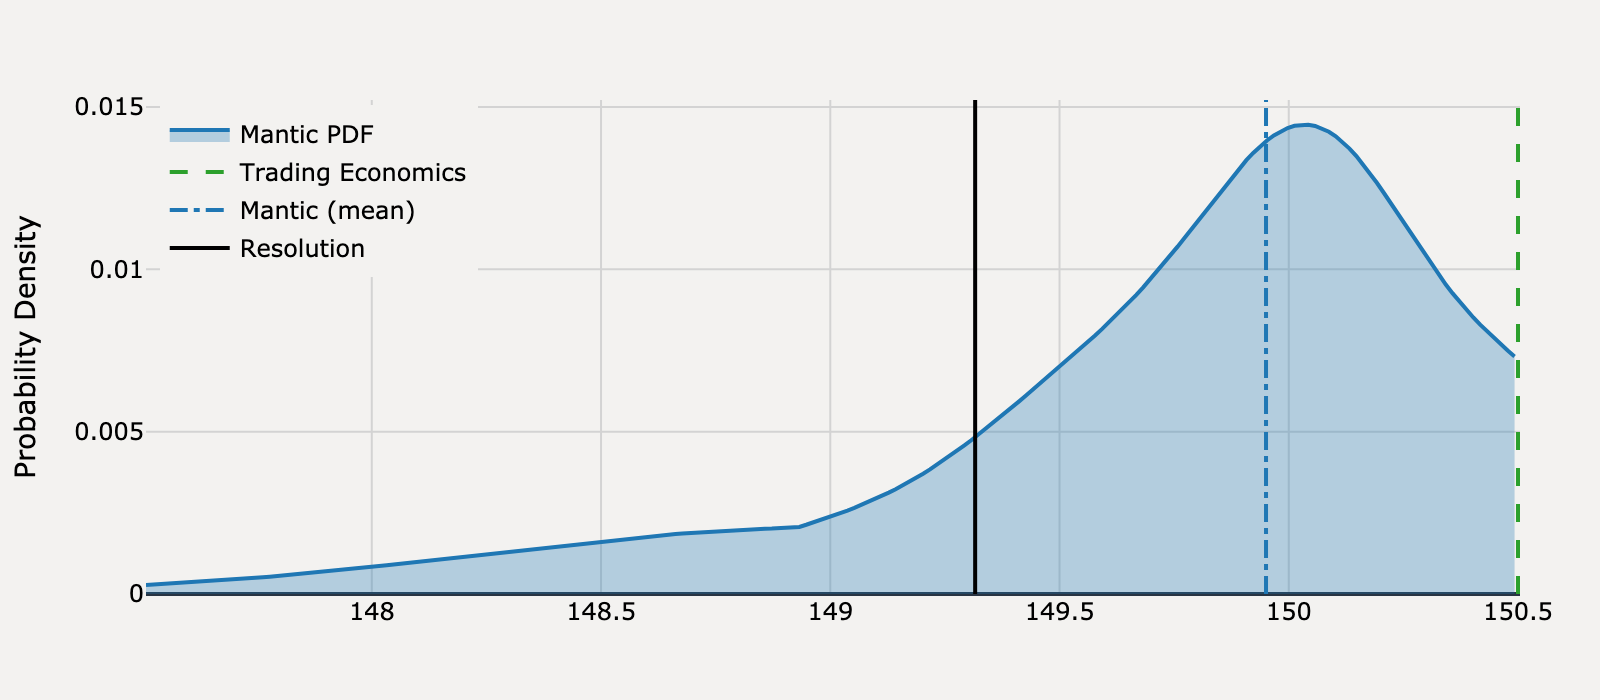
Actual Resolution: 149.3
Best RMSE: Mantic
Mantic (mean)
150.0BEST
Trading Economics
150.5
Consensus
-
RMSE
Mantic (mean)
0.402
Trading Economics
1.40
View Mantic Prediction Analysis
- The central forecast for the US Producer Price Index for August 2025 is 150.02 points.
- This prediction is anchored to the estimated July 2025 PPI value of 149.65 points. This estimate is derived from the reported 3.3% year-over-year increase for the 12 months ending July.
- The index's upward momentum is driven by tariff-related costs and service price increases, which caused an unexpected 0.9% month-over-month PPI surge in July 2025.
- The August outlook is confirmed by the high ISM Manufacturing Prices Index, which registered 63.7%, signaling continued high input cost inflation for US producers.
- The forecast implies a modest gain from July, balancing sustained core inflation and cost pass-through against the statistical likelihood of mean reversion after July's highly volatile price spikes.
What will United States Producer Prices be for September 2025?
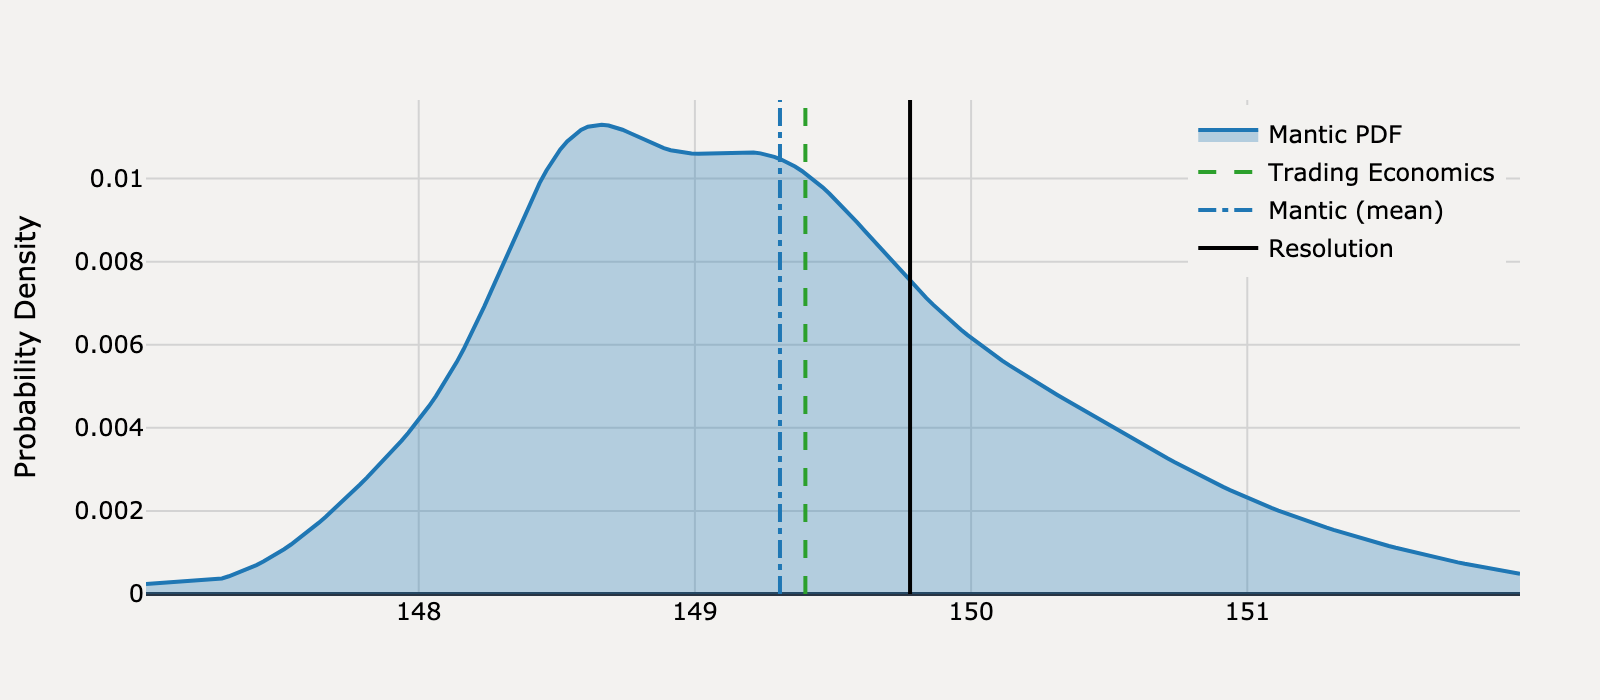
Actual Resolution: 149.8
Best RMSE: Trading Economics
Mantic (mean)
149.3
Trading Economics
149.4BEST
Consensus
-
RMSE
Mantic (mean)
0.222
Trading Economics
0.144
View Mantic Prediction Analysis
- I estimate United States Producer Prices for September 2025 at 149.0 points, with a 50% confidence interval from 149.0 to 150.0 points.
- The last reported value in the Trading Economics series was 147.686 points in April 2025, showing the recent level before the forecast period.
- Upward pressure is signaled by ISM price indices for September 2025, with Manufacturing at 61.9% and Services at 69.4%, indicating broad-based input cost increases.
- Tariff policy continues to drive persistent cost pass-through, with manufacturers citing increased pricing on engineered and manufactured goods.
- The official -0.1% month-over-month decline in the August 2025 PPI Final Demand and a strong US Dollar (EUR/USD near 0.86) help temper the expected September price increase.
What will US Retail Sales be for January 2025?
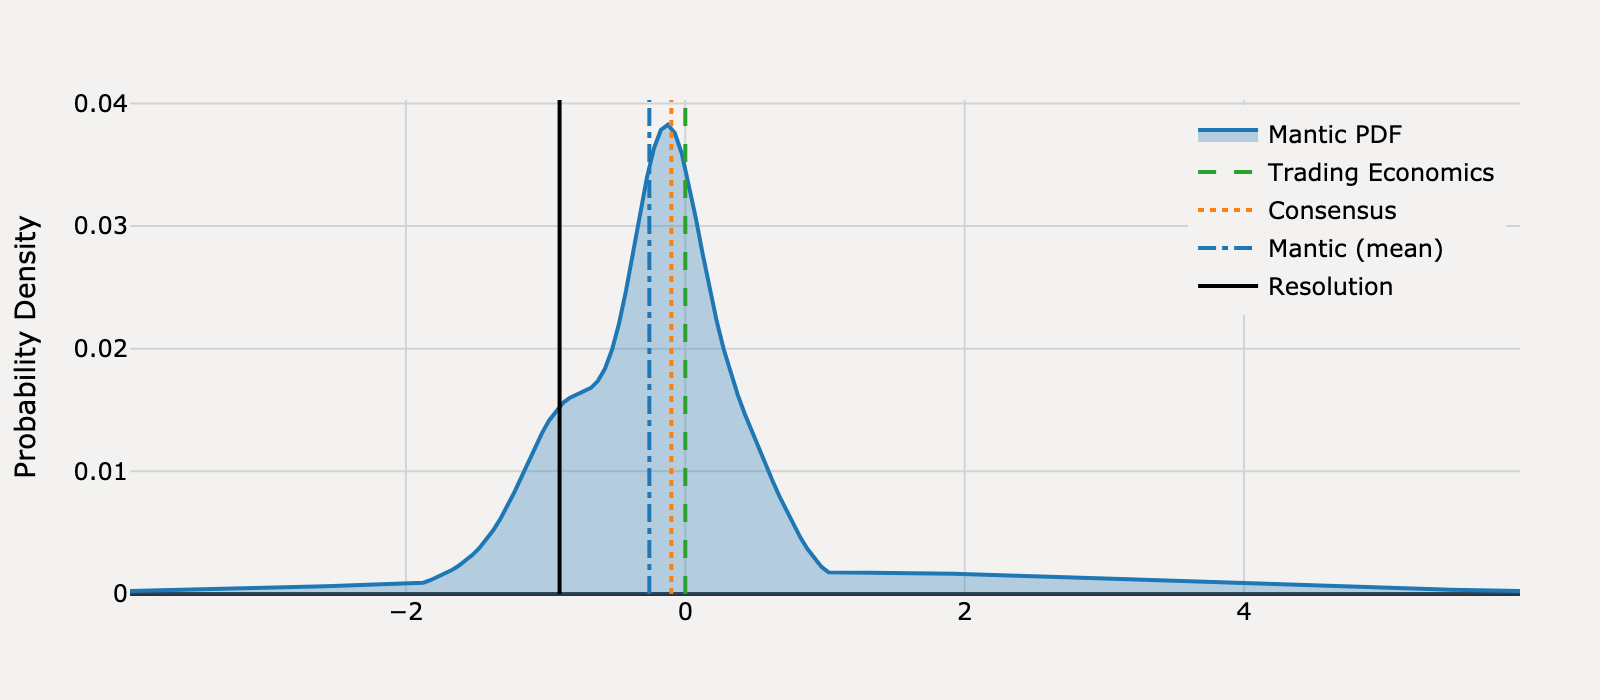
Actual Resolution: -0.9
Best RMSE: Mantic
Mantic (mean)
-0.257BEST
Trading Economics
0
Consensus
-0.1
RMSE
Mantic (mean)
0.413
Trading Economics
0.81
Consensus
0.64
View Mantic Prediction Analysis
- I forecast United States Retail Sales (MoM) for January 2025 to be -0.15%, with a 50% confidence interval spanning -0.62% to +0.29%.
- This mild contraction is primarily driven by a seasonal pullback following the strong 0.6% MoM gain reported for December 2024.
- The sharp decline in the projected Seasonally Adjusted Annual Rate (SAAR) for new vehicle sales, from 17.1 million units in December to 15.6 million in January (J.D. Power), acts as a significant mechanical headwind.
- Unusually severe winter weather in January, reported as the coldest since 2011, introduces substantial downside risk, evidenced by a similar -0.9% MoM decline in retail sales during January 2024.
- Underlying consumer resilience and positive growth in sectors like small business sales (+0.5% MoM, Fiserv) partially offset the weather and seasonal drag, particularly through online channels.
What will US Retail Sales be for February 2025?
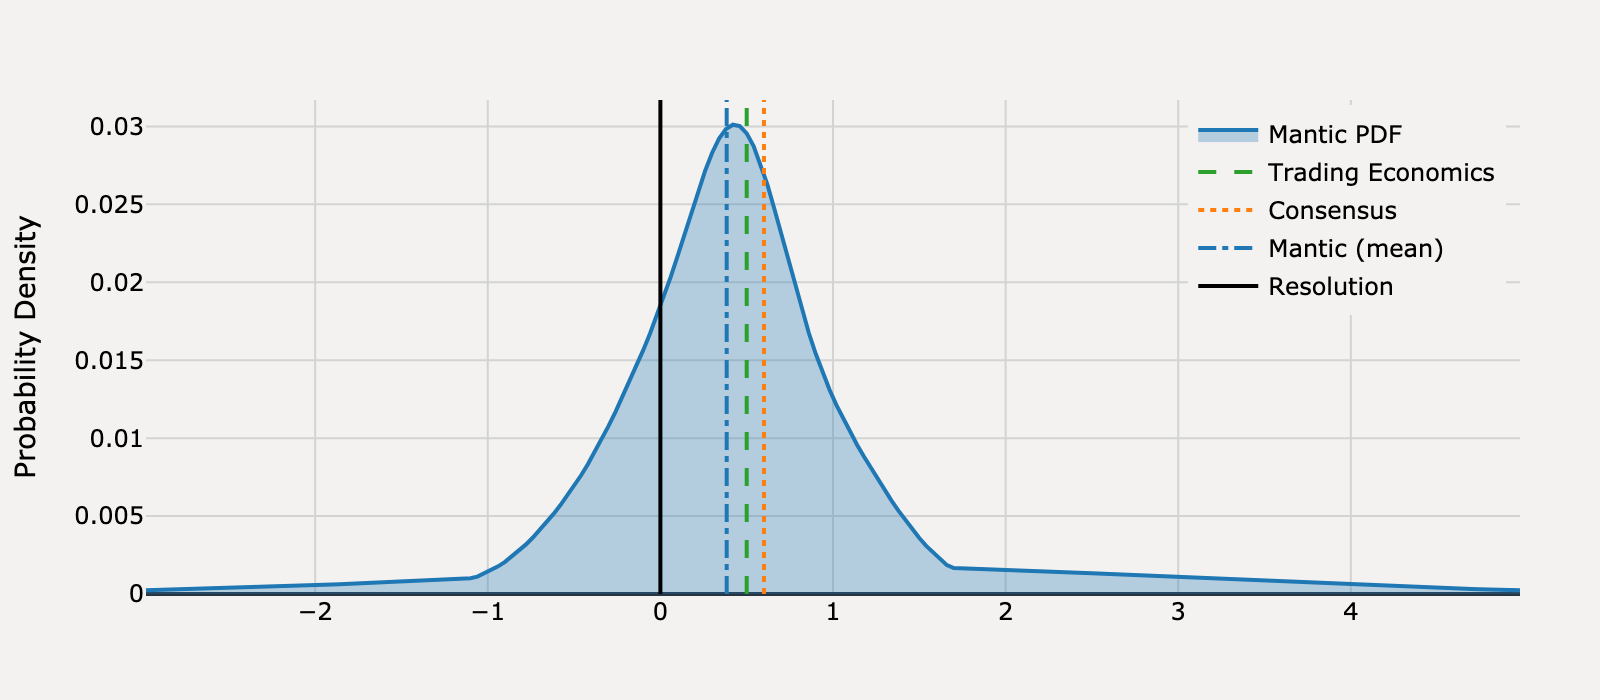
Actual Resolution: 0
Best RMSE: Mantic
Mantic (mean)
0.384BEST
Trading Economics
0.5
Consensus
0.6
RMSE
Mantic (mean)
0.147
Trading Economics
0.25
Consensus
0.36
View Mantic Prediction Analysis
- I project the U.S. Retail Sales MoM for February 2025 will be 0.43% (median estimate), reflecting a modest rebound from January's -0.9% decline.
- The recovery is dampened by specific sectoral weakness, notably the auto segment, which saw new vehicle movement fall for the second consecutive month in February (ZeroSum).
- Underlying support for consumer spending remains due to a tight labor market (4.1% unemployment in February) and high nominal personal income levels (Jan 2025 peak).
- Consumer sentiment deteriorated sharply in February, with the Conference Board Index recording its largest monthly decline since August 2021, signaling consumer reluctance toward discretionary spending.
- The ISM Services PMI indicated the Retail Trade industry experienced a contraction in business activity and new orders during February.
What will US Retail Sales be for March 2025?
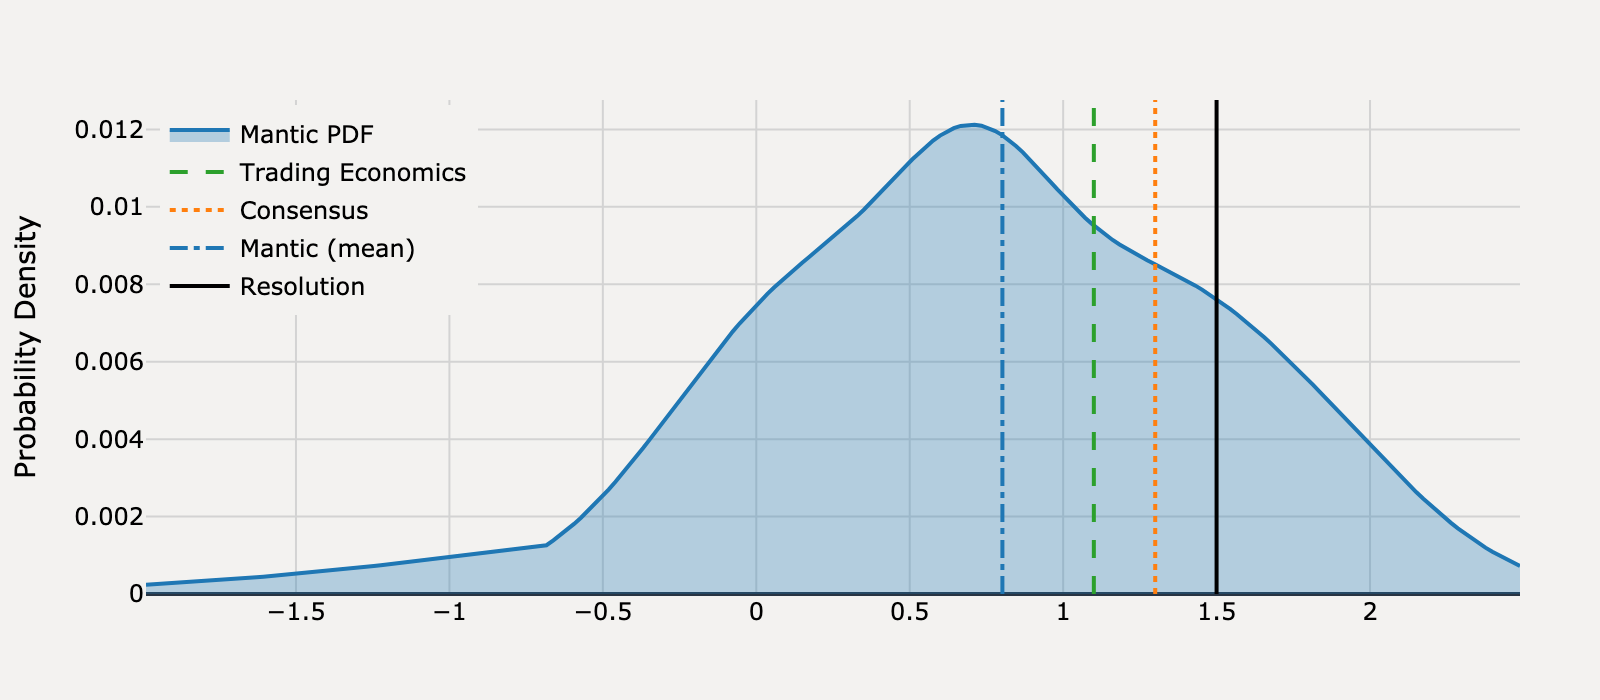
Actual Resolution: 1.50
Best RMSE: Consensus
Mantic (mean)
0.802
Trading Economics
1.10
Consensus
1.30BEST
RMSE
Mantic (mean)
0.487
Trading Economics
0.16
Consensus
0.04
View Mantic Prediction Analysis
- I forecast United States Retail Sales MoM for March 2025 to be 0.74% (median estimate), driven primarily by a massive, idiosyncratic surge in auto purchases.
- This surge in auto sales reflects consumers pulling forward purchases in March to avoid expected price increases due to new tariffs, a factor supported by the new-vehicle retail SAAR rising to 17.8 million.
- The upward pressure from vehicle sales, a major component of the total figure, is largely offset by a broad deceleration in discretionary spending.
- The University of Michigan Consumer Sentiment index fell sharply to 57.0 in March, its lowest level in two years, signaling widespread consumer caution.
- Nominal sales also face a downward pressure from the 6.3% month-over-month decline in the CPI energy index, primarily due to lower gasoline prices in March.
What will US Retail Sales be for April 2025?
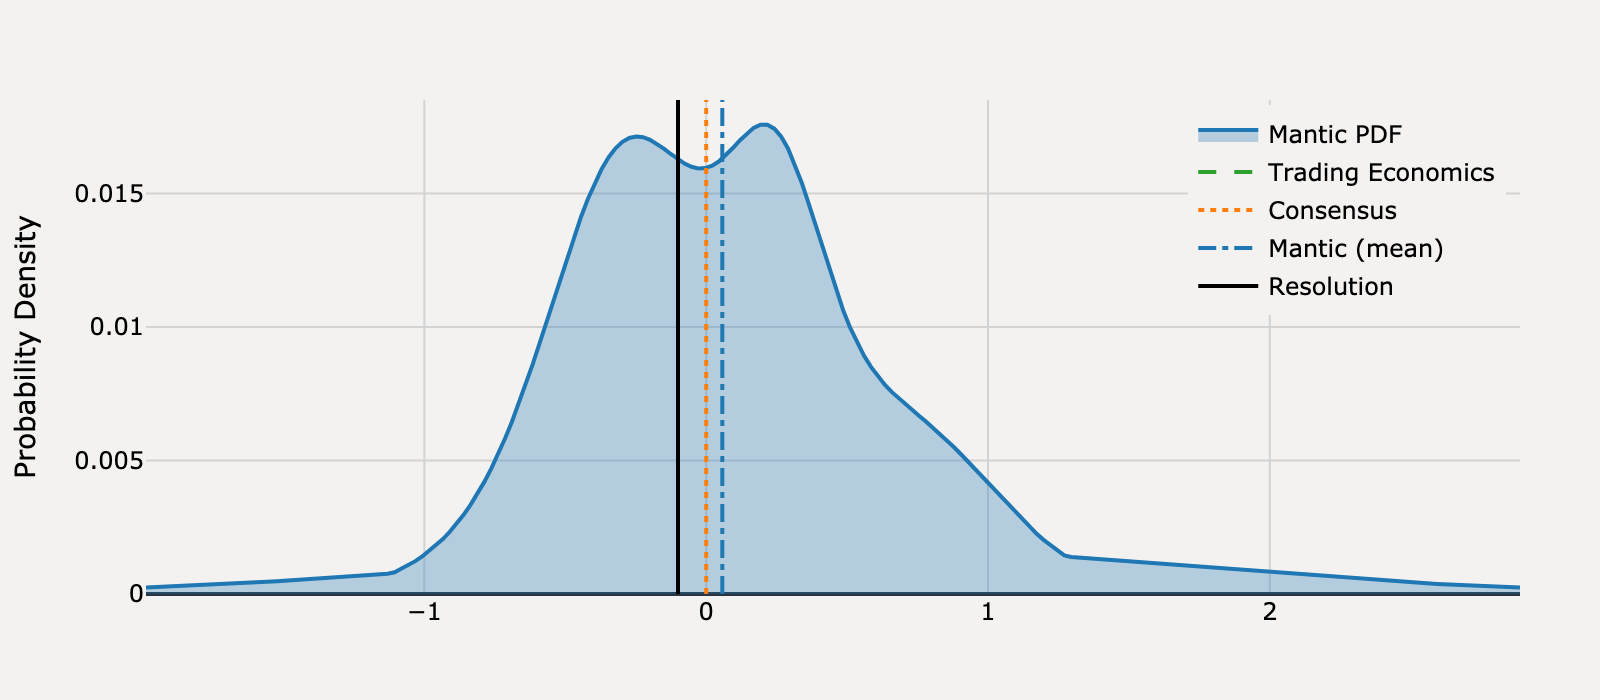
Actual Resolution: -0.1
Best RMSE: Trading Economics
Mantic (mean)
0.057
Trading Economics
-0.1BEST
Consensus
0
RMSE
Mantic (mean)
0.025
Trading Economics
0
Consensus
0.01
View Mantic Prediction Analysis
- I forecast US Retail Sales MoM for April 2025 to be 0.1%, with a 50% confidence interval spanning -0.34% to 0.46%.
- The forecast anticipates a sharp correction following the 1.4% surge in March 2025, which was driven by a significant pull-forward of purchases, primarily in the auto sector, ahead of tariff concerns.
- The largest drag is expected from the auto component, which saw a 5.3% MoM spike in March, creating substantial pressure for mean reversion in the headline sales figure.
- This anticipated correction is partially offset by the calendar effect of a late Easter holiday and modest sustained growth in core spending, as suggested by the +0.4% MoM sales increase reported by the Fiserv Small Business Index for April.
- Broader consumer sentiment has deteriorated sharply (Michigan Consumer Sentiment was 57.0 in March), indicating underlying consumer fragility and increased plans to cut back on discretionary spending going forward.
What will US Retail Sales be for May 2025?
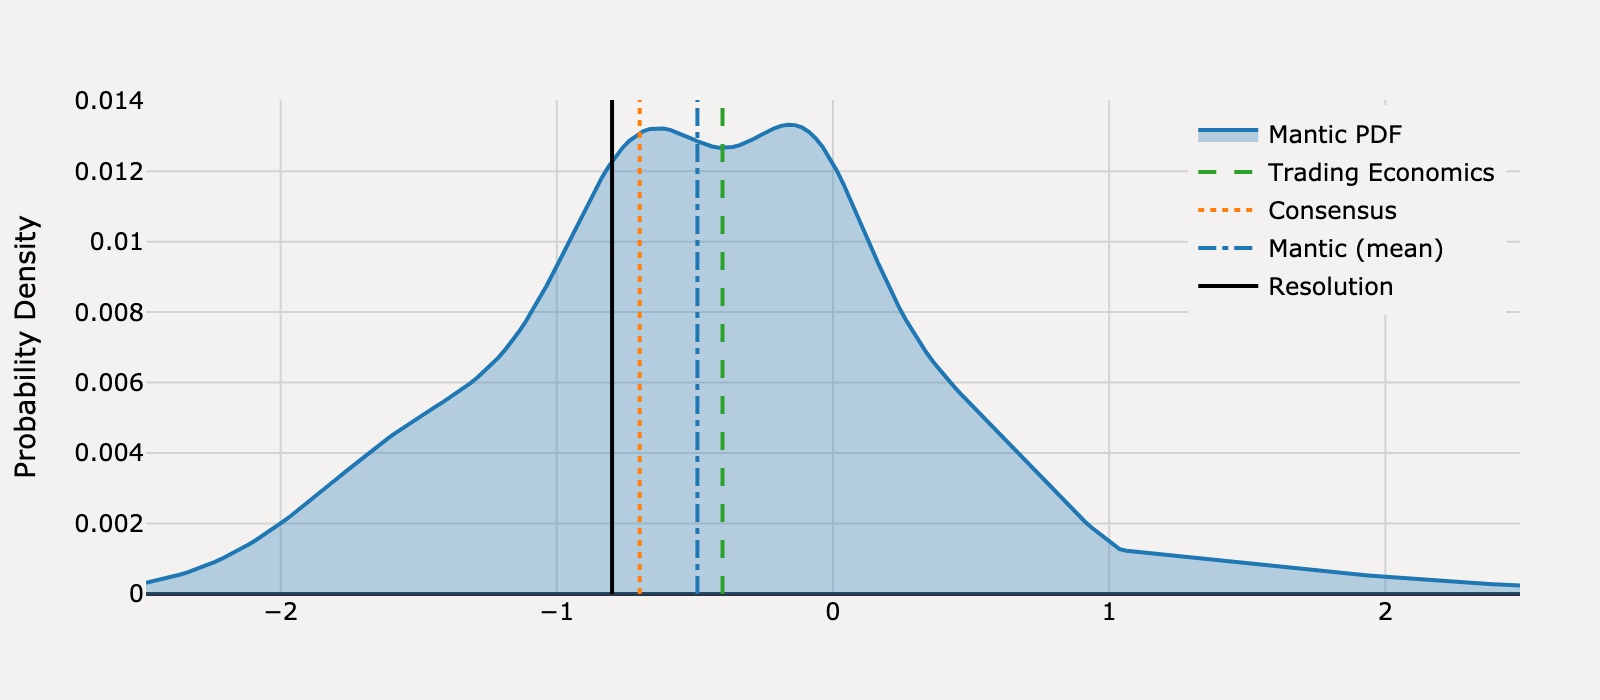
Actual Resolution: -0.8
Best RMSE: Consensus
Mantic (mean)
-0.491
Trading Economics
-0.4
Consensus
-0.7BEST
RMSE
Mantic (mean)
0.095
Trading Economics
0.16
Consensus
0.01
View Mantic Prediction Analysis
- I forecast the US Retail Sales MoM for May 2025 at a median of -0.43%, indicating a modest contraction from the prior month's reading of -0.1% in April 2025.
- The largest single drag is the auto sector, where the SAAR of light vehicle sales dropped sharply to 15.65 million units in May from 17.25 million in April.
- Broad consumer demand is weakening, evidenced by the University of Michigan Consumer Sentiment Index falling to 52.2 in May 2025, the lowest reading in a year.
- This anticipated contraction reflects a "hangover" in durable goods sales following front-loaded buying in Q1 2025 ahead of anticipated tariffs.
- This weakness is partially offset by strong nominal spending power, as average hourly earnings increased 0.4% MoM and 3.9% YoY in May 2025.
What will US Retail Sales be for June 2025?
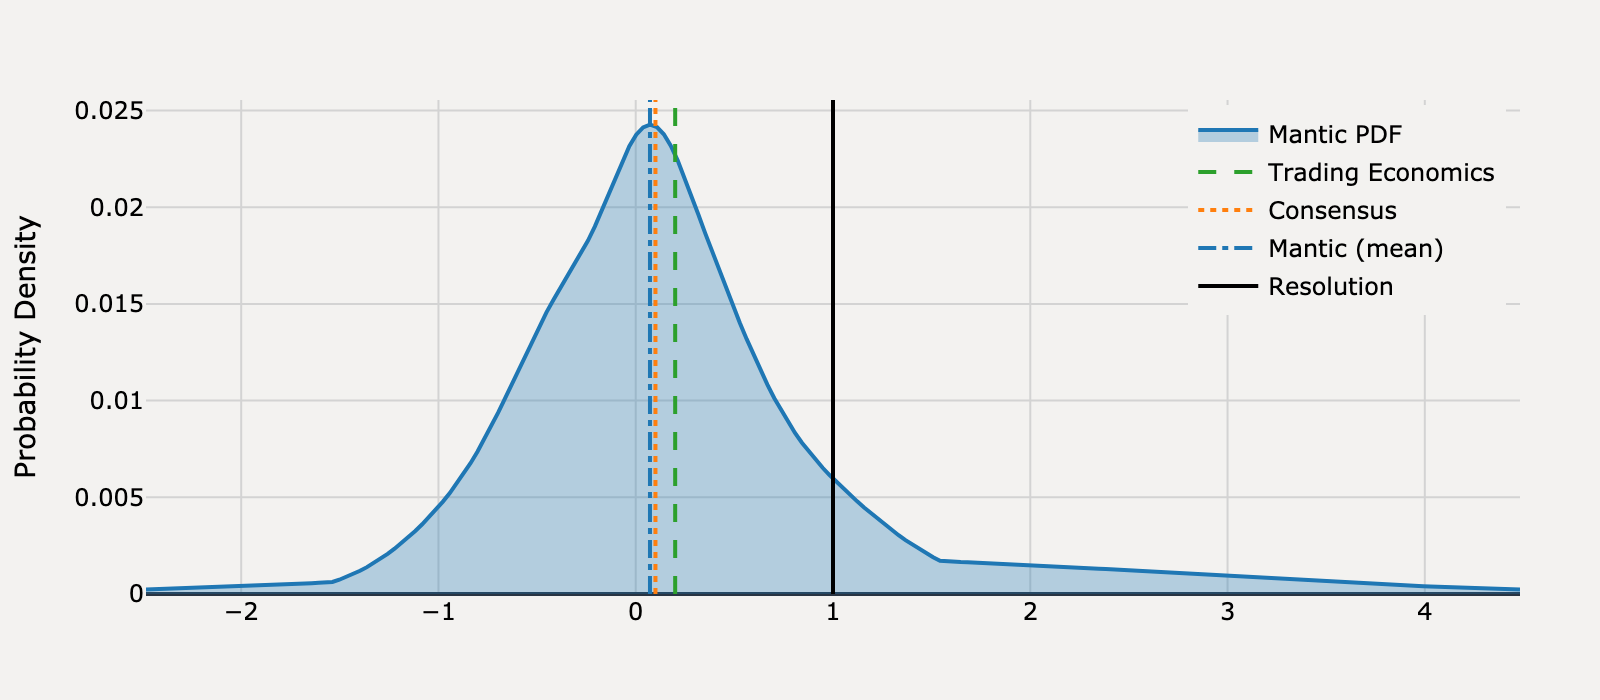
Actual Resolution: 1.00
Best RMSE: Trading Economics
Mantic (mean)
0.072
Trading Economics
0.2BEST
Consensus
0.1
RMSE
Mantic (mean)
0.861
Trading Economics
0.64
Consensus
0.81
View Mantic Prediction Analysis
- I forecast the US Retail Sales MoM for June 2025 at a median of 0.1%, aligning precisely with the professional consensus forecast.
- The 50% confidence interval for the outcome spans -0.34% to 0.59%, reflecting the high month-to-month volatility of the series (std dev ~0.76%).
- The University of Michigan Consumer Sentiment index rebounded sharply to 60.7 in June from 52.2 in May, suggesting a moderation of consumer caution.
- Downside pressure is substantial due to specific category weakness; the auto sales annualized rate fell to 15 million in June, and small business sales declined 1.4% MoM (Fiserv).
- Resilience in the large-format retail sector provides a positive counter-signal, with Costco reporting 4.7% comparable US sales growth for the retail month of June.
What will US Retail Sales be for July 2025?
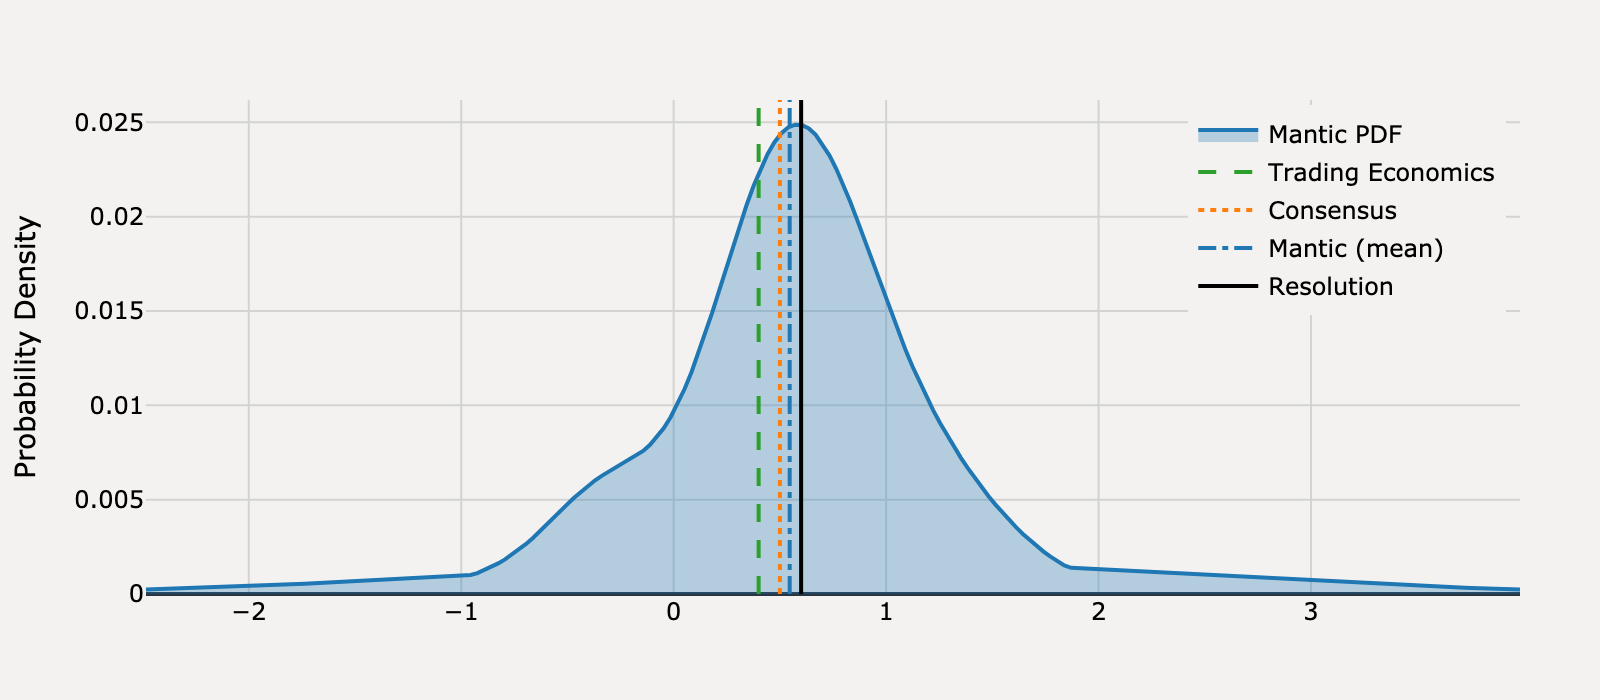
Actual Resolution: 0.6
Best RMSE: Mantic
Mantic (mean)
0.546BEST
Trading Economics
0.4
Consensus
0.5
RMSE
Mantic (mean)
0.003
Trading Economics
0.04
Consensus
0.01
View Mantic Prediction Analysis
- I estimate the United States Retail Sales month-over-month (MoM) for July 2025 will be +0.6%, with an 80% confidence interval spanning from a decline of -0.4% to a high of +1.5%.
- The strength is primarily driven by specific July events, including Amazon's record-setting Prime Day, which contributed to $24.1 billion in US online sales according to Adobe.
- The Auto component provides a significant tailwind, with J.D. Power forecasting new-vehicle retail sales to reach a 16.4 million unit Seasonally Adjusted Annual Rate in July, up sharply from June's 15.2 million.
- This forecast is slightly above the market consensus of +0.5% and aligns with the previous month’s official reading of +0.6% (June 2025).
- Headwinds exist from broader consumer caution and "thriftiness" reported by retailers, suggesting strong performance is concentrated in deal-driven events and essential categories.
What will US Retail Sales be for August 2025?
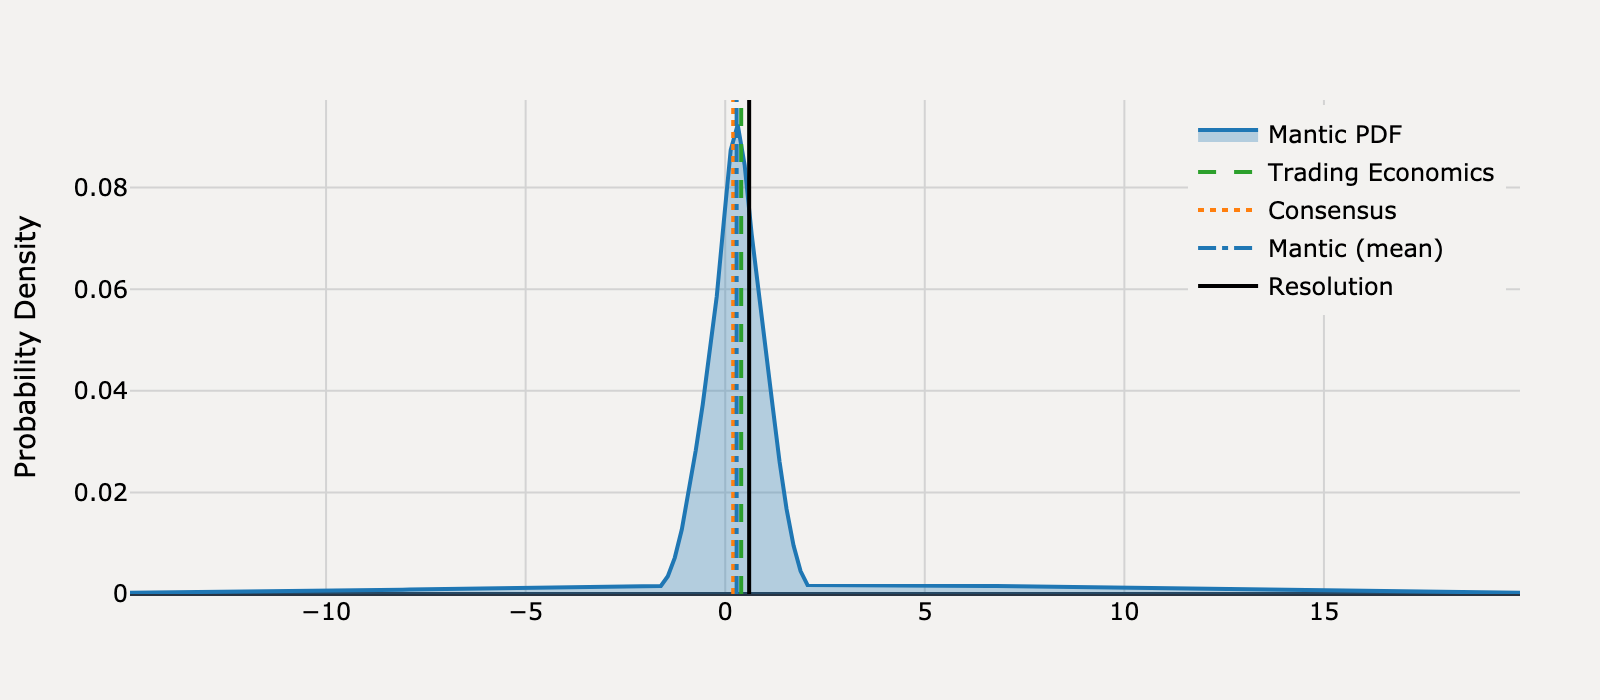
Actual Resolution: 0.6
Best RMSE: Trading Economics
Mantic (mean)
0.286
Trading Economics
0.4BEST
Consensus
0.2
RMSE
Mantic (mean)
0.098
Trading Economics
0.04
Consensus
0.16
View Mantic Prediction Analysis
- I forecast that the United States Retail Sales Month-over-Month (MoM) for August 2025 will be +0.34% with a 50% confidence interval ranging from -0.26% to +0.98%.
- The forecast reflects a highly divergent set of drivers: strong nominal sales in the auto sector contrasted with a suddenly weak labor market.
- New-vehicle sales provided a significant boost to the August headline figure, with industry estimates showing record consumer spending of $54.6 billion for the month.
- This strength is severely offset by macroeconomic headwinds, including a sharp rise in the unemployment rate to 4.3% and a disappointing gain of only 22,000 jobs in August.
- Consumer sentiment fell sharply in August to 58.2, confirming deepening pessimism that is likely to weigh heavily on discretionary and non-essential retail spending.
What will US Retail Sales be for September 2025?
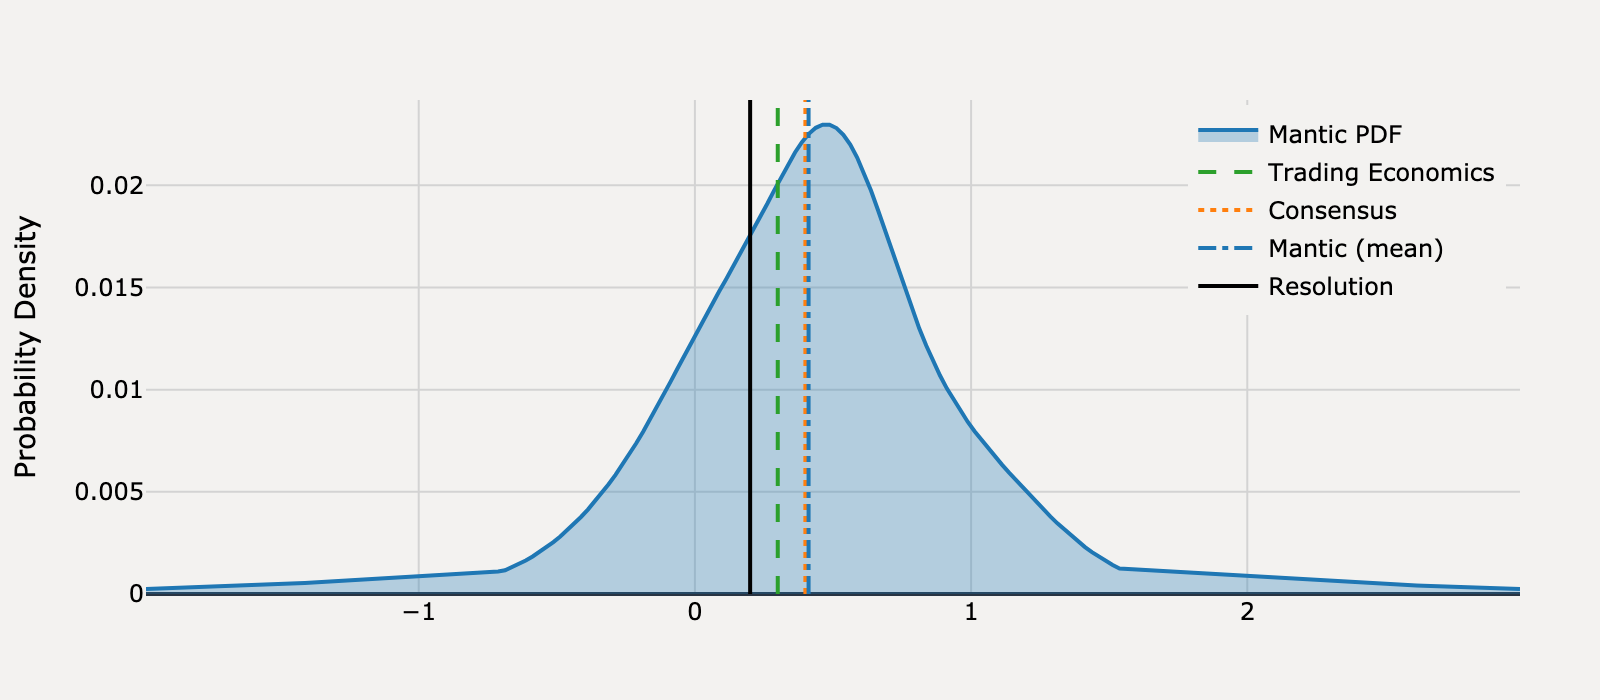
Actual Resolution: 0.2
Best RMSE: Trading Economics
Mantic (mean)
0.412
Trading Economics
0.3BEST
Consensus
0.4
RMSE
Mantic (mean)
0.045
Trading Economics
0.01
Consensus
0.04
View Mantic Prediction Analysis
- I estimate the median U.S. Retail Sales MoM for September 2025 is 0.44%, with an 80% confidence interval spanning -0.30% to 1.20%.
- The prediction aligns closely with the FactSet median consensus of 0.4%, despite the official Census Bureau data release being delayed by a government shutdown.
- The positive headline print is mechanically supported by a 4.1% MoM rise in the gasoline CPI index, boosting nominal gas station sales.
- New vehicle sales also contributed significantly; spending reached $45.0 billion, accelerated by the expiration of federal EV tax credits.
- Underlying strength is suspect, as third-party data showed core retail sales (excluding auto and gas) declined by 0.66% MoM, reflecting slowing consumer discretionary spending.